Understanding Performance in 5 Minutes
The biggest concern for prospective customers is their fear that our products will use up all their time: after all, we collect a huge number of datapoints (for the sake of simplicity around 1500 datapoints every second). And I guess that many among you have made bad experiences from the past where systems were not as evolved as today and that at least one scientist (like me during my PhD at EPFL) was required to manually go through the data streams to extract useful information. Results were available only days or even months after the recordings took place.
Fortunately, today, at least with our products at Archinisis, things have changed: our data analysis is 99% automated and results are displayed on easy-to-understand and interactive figures. And, the cherry on the cake: videos are automatically synchronized with the collected data!
As not all of you have the possibility for an on-site demo with us, I will try to explain here in a few words how our solution works. Of course, I will not be able to show all analysis options. You can always reach out to contact@archinisis.ch for a 1:1 online demo. A big thanks to Markus Walser from Team BSV IBEX for letting me use his team's data for this blog and a few more upcoming ones.
The five steps towards understanding performance:
Step 1: Prepare
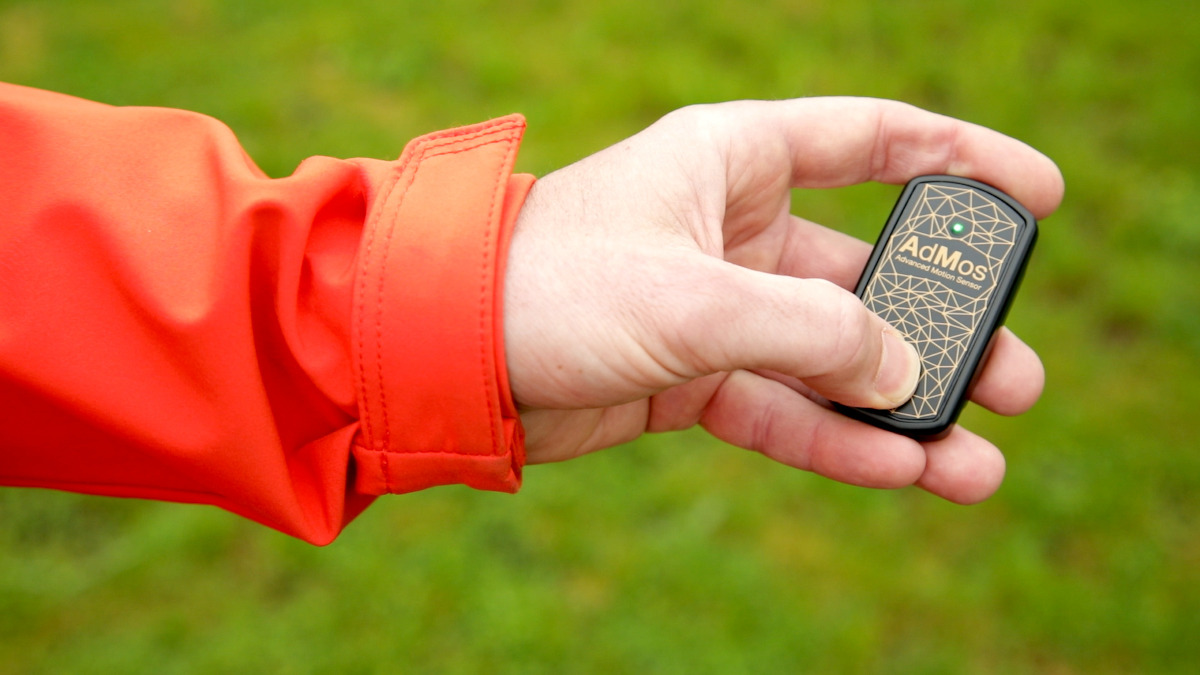
Switch on the sensor and leave it for 20 minutes somewhere outdoors in the shade but with good visibility to the sky. This ensures that the sensor receives the maximum number of satellites. Usually we can obtain 20 – 25 satellites. Athletes can warm up during this time.
Step 2: Give the sensor to the athlete
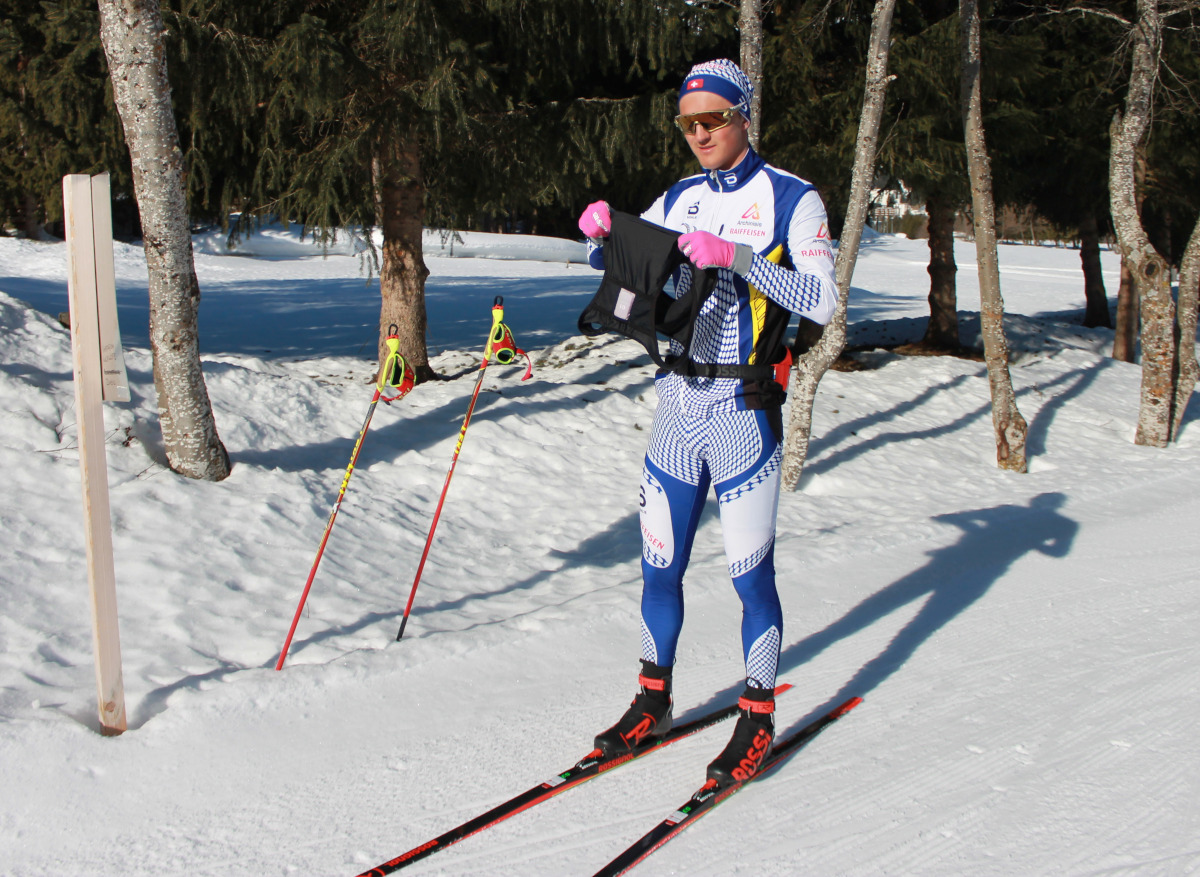
Each athlete receives one sensor. We provide dedicated shirts with a small pocket for the sensor on the upper back. Make sure that the LED is visible, otherwise the sensor is the wrong way and the GNSS antenna is pointing towards the body...
Step 3: Train or compete
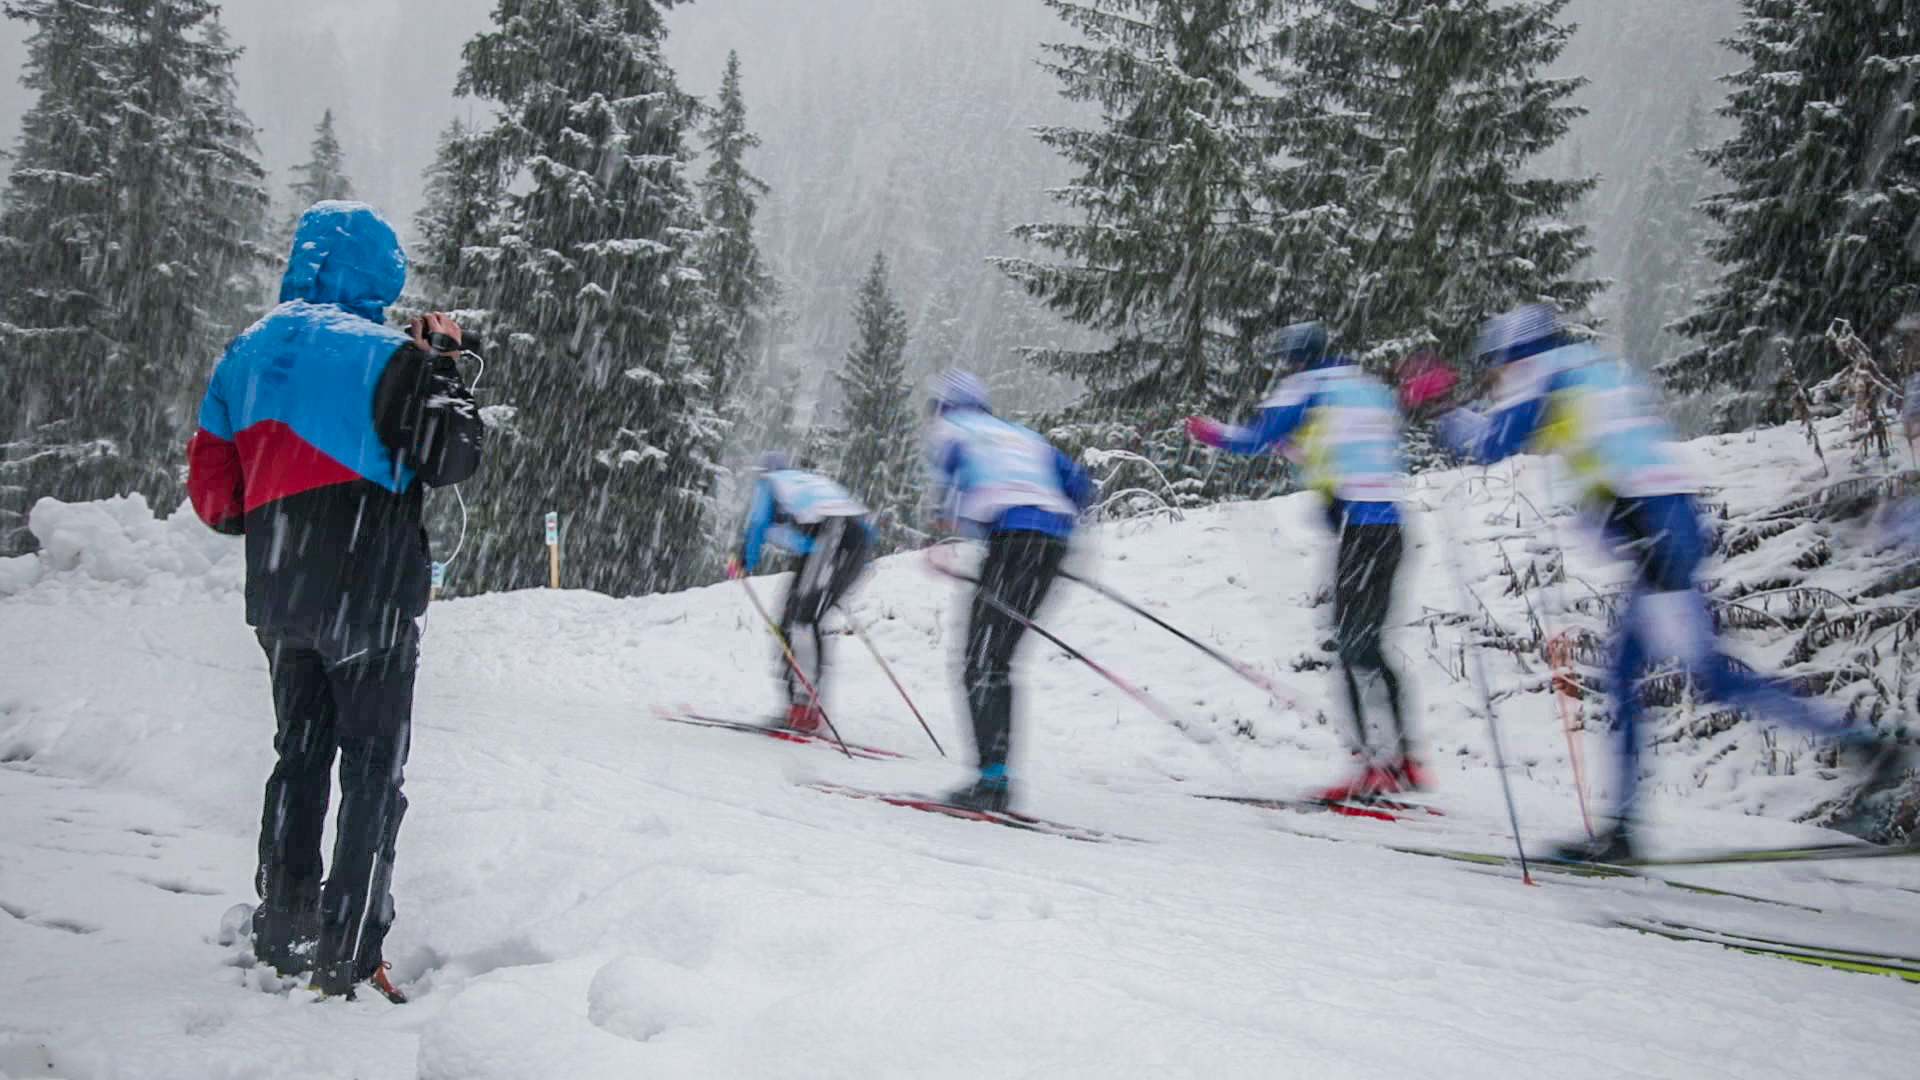
The athlete is doing his training or competition as usual. No manipulation and no interaction are needed: the athlete focuses on his training and the coach observes the athletes. For technical training sessions it is also possible to record videos. Any video camera with a microphone input can be used. We provide a video synchronization unit that later allows you to automatically synchronize the videos with the data.
Step 4: Transfer and process the data
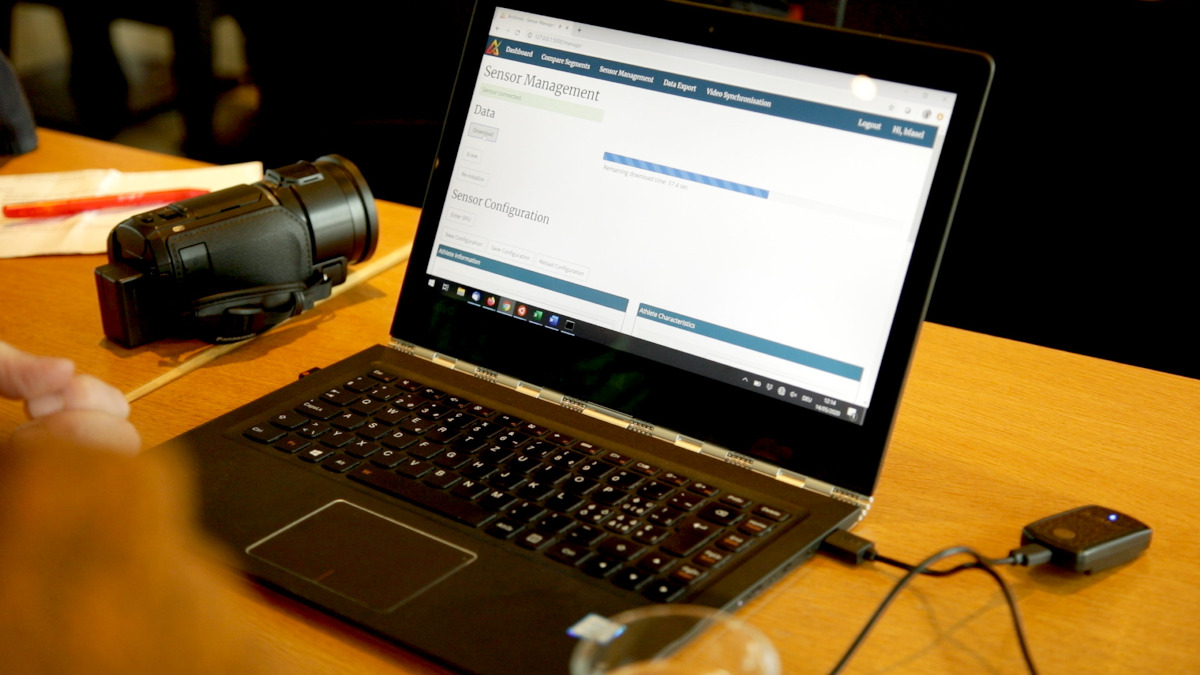
Three "sub-steps" are needed with our current GNSS-IMU sensor:
- Download the sensor data: After the training, take the sensor from the athlete and switch it off. Connect it to the USB of your computer, android tablet or smartphone and download the data. Depending on how long your training session was, this may take up to 5 minutes.
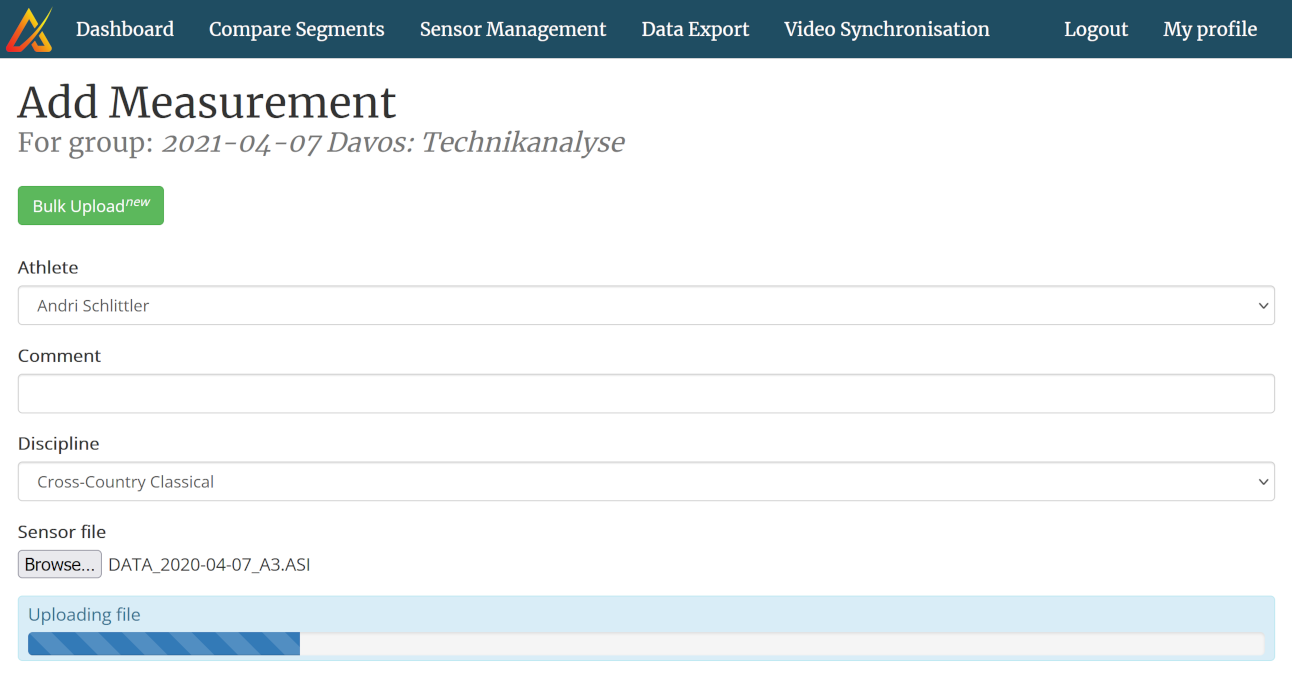
- Add the data to the webapp: In this step you upload the data to our webapp and assign it to an athlete. First, create a new measurement group and assign it to a place. Second, upload the data for each athlete (depending on your internet connection this may take a few minutes). Third, click on the link "Smart Segmentation" and wait a few seconds.
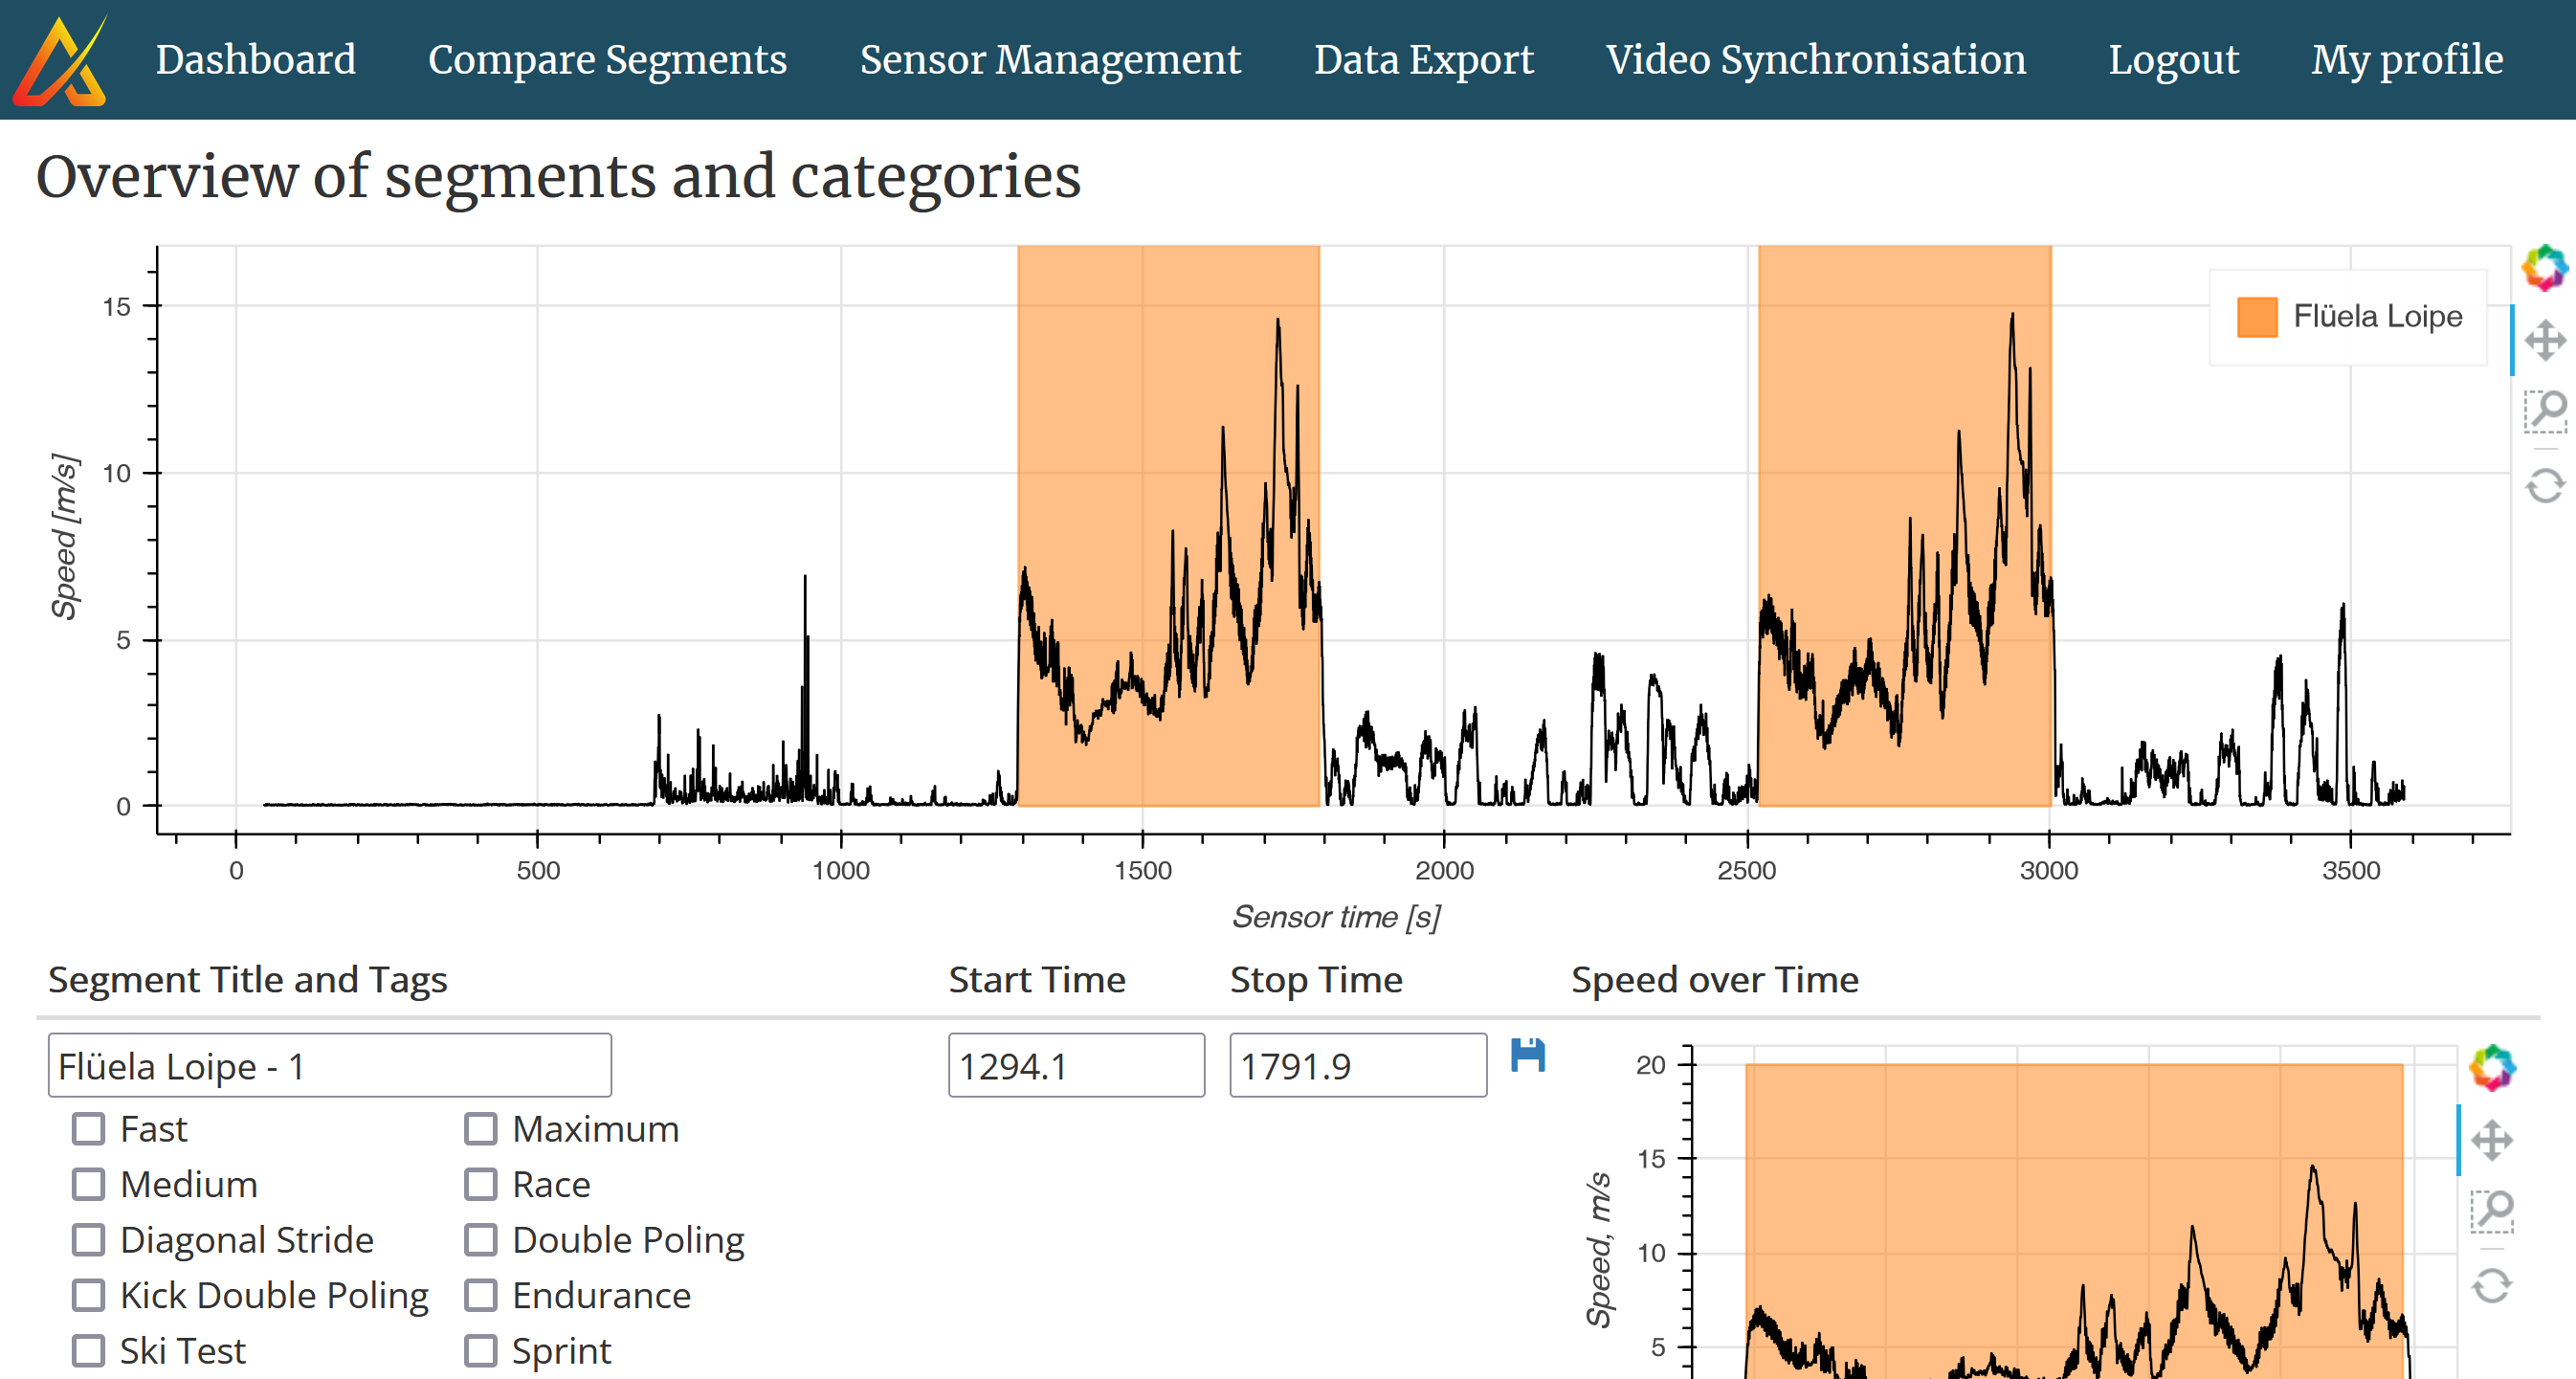
- Mark the segments of interest: The smart segmentation automatically identifies all reference tracks / laps / loops you previously created in the webapp (this is a different story we will explain in another blog post). Select all the segments you would like to keep for the analysis. This step is simply to offer you the possibility to exclude, for example, the warm-up or cool-down laps. And now you are done with the analysis.
All in all, these three "sub-steps" will take about 3-5 minutes per athlete.
Step 5: Visualize the Performance
Now all is ready to visualize the performance. We offer different levels of details: from a cycle-by-cycle display with in-dept information up to an overall race / training report that can be shared with athletes.
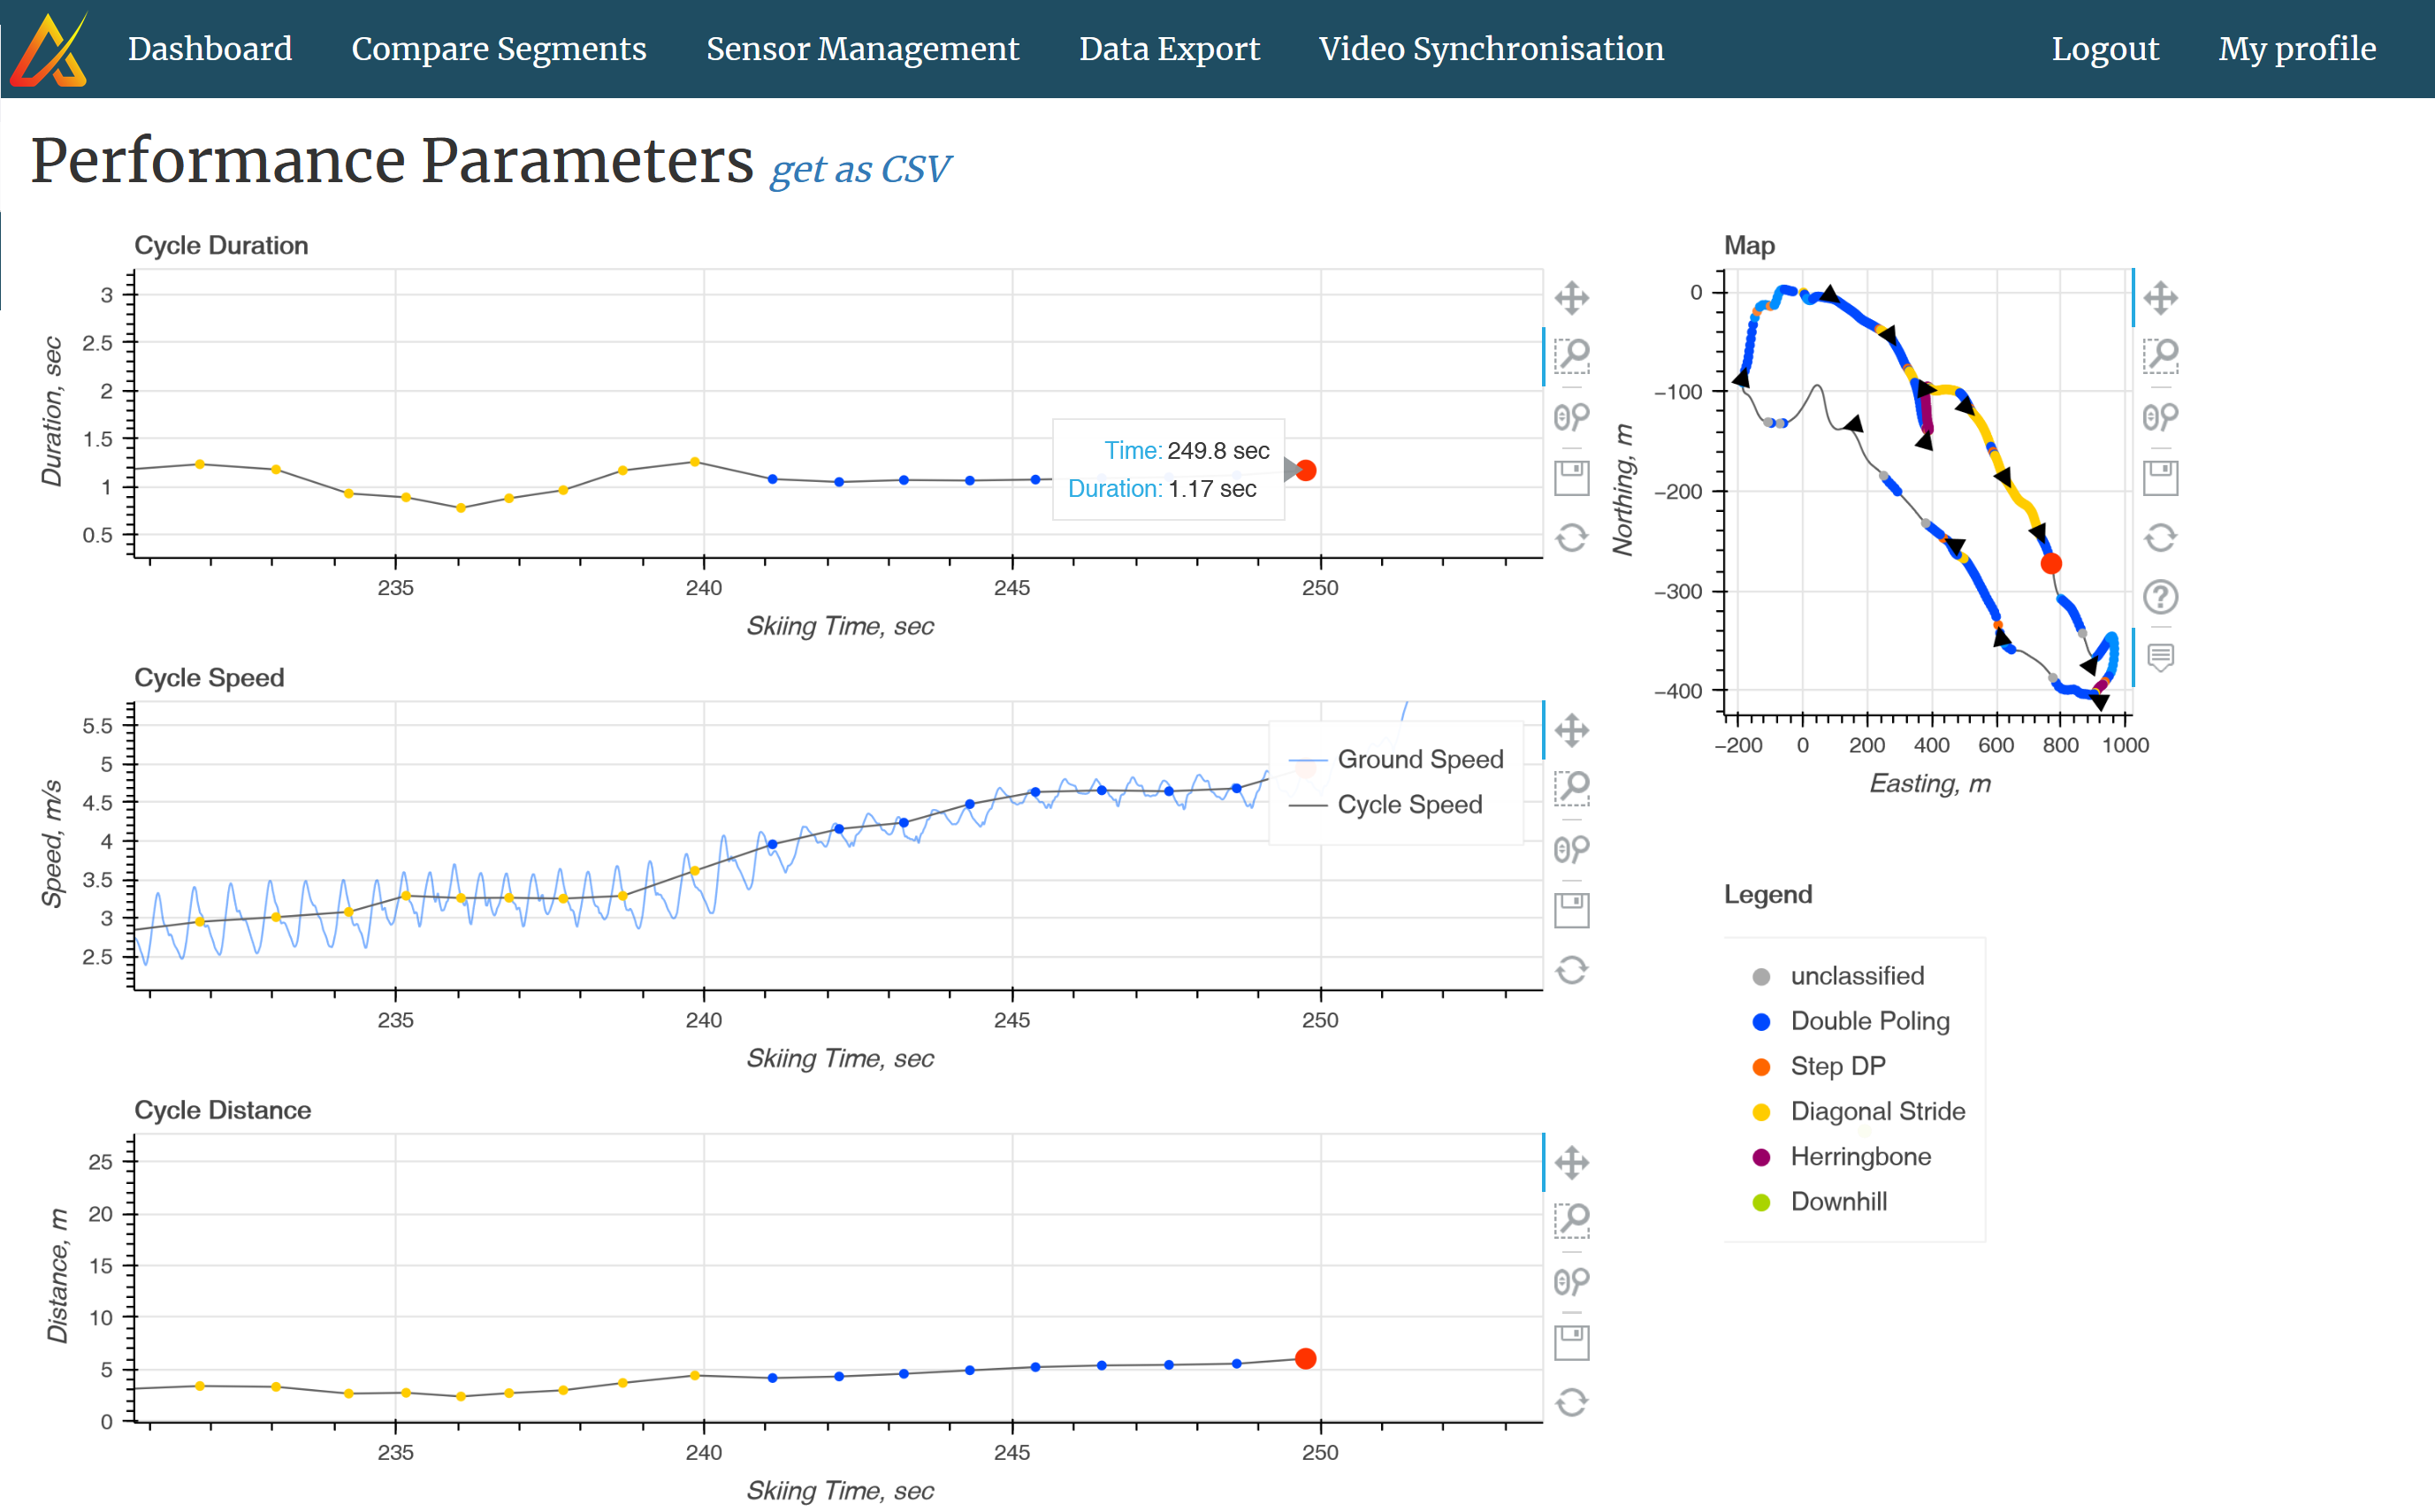
Cycle-by-Cycle Display
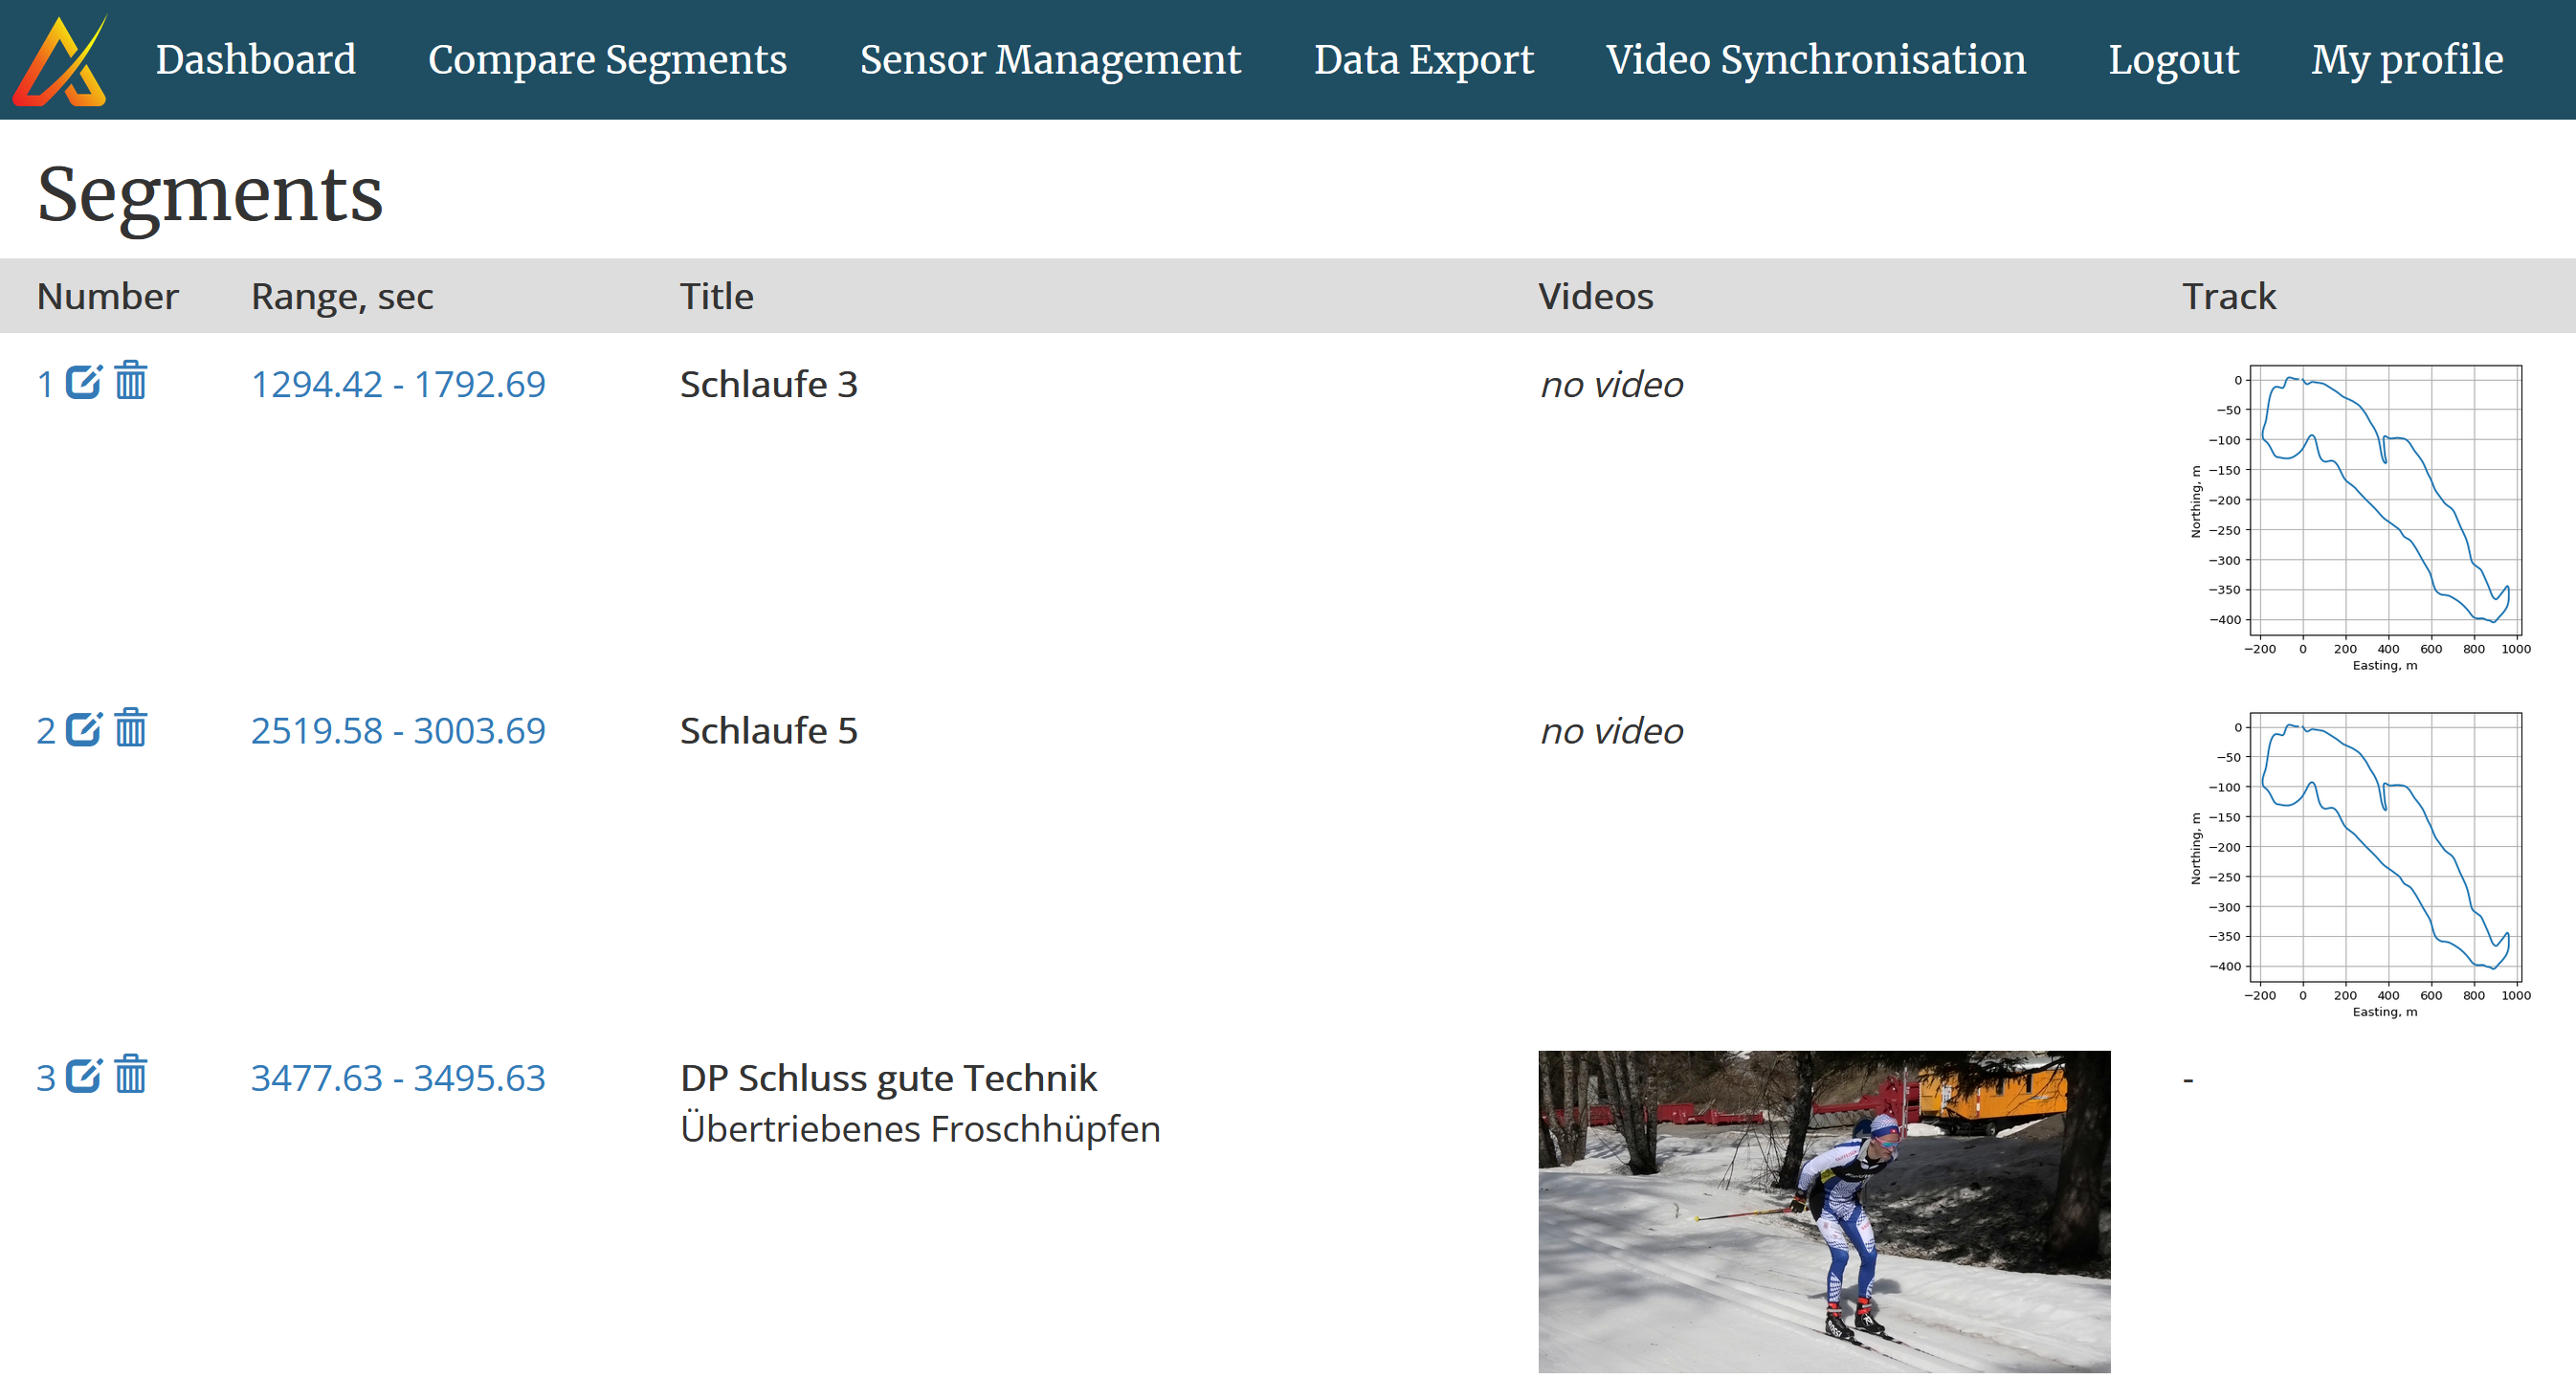
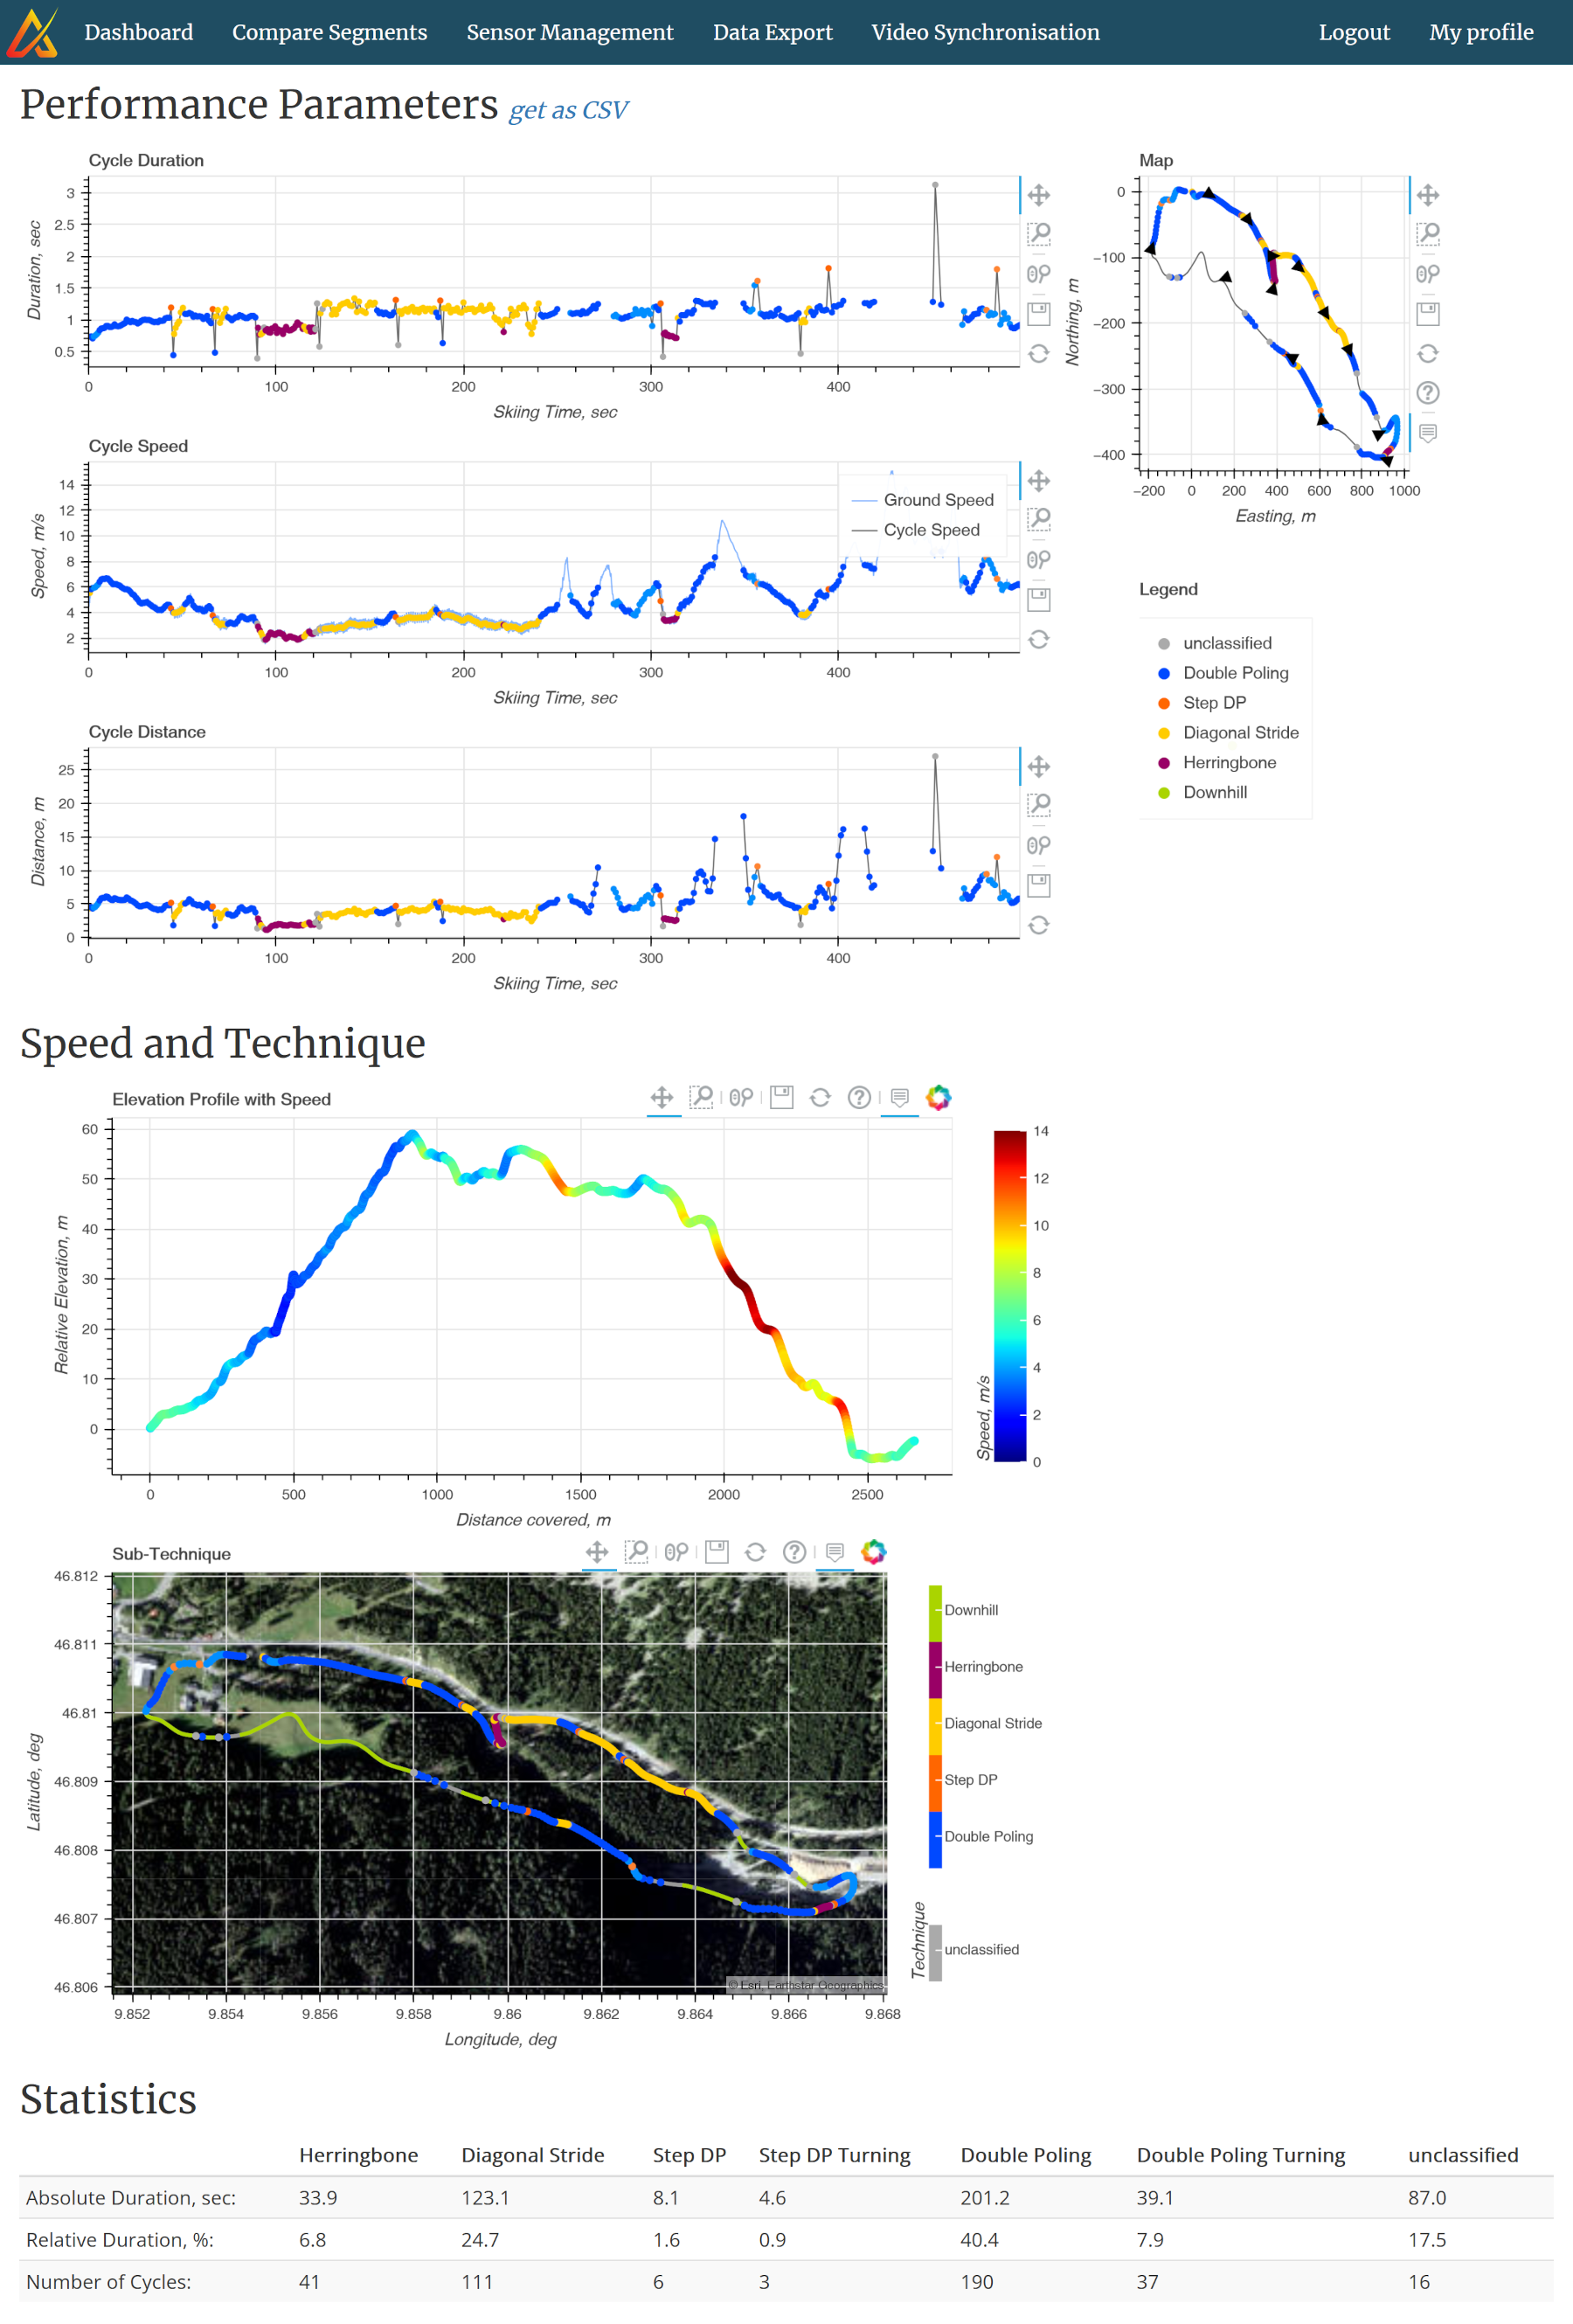
The performance of individual segments, with all details, can be visualized on the segment display page, reachable via the measurement overview page. On the top of the page, you can find the cycle parameters (cycle duration, speed, distance), the sub-technique classification, and a map. Further down the elevation profile with color-coded speed is displayed, along with a large map with a satellite image. On the very bottom of the page there is a table with a summary of how much each sub-technique was skied.
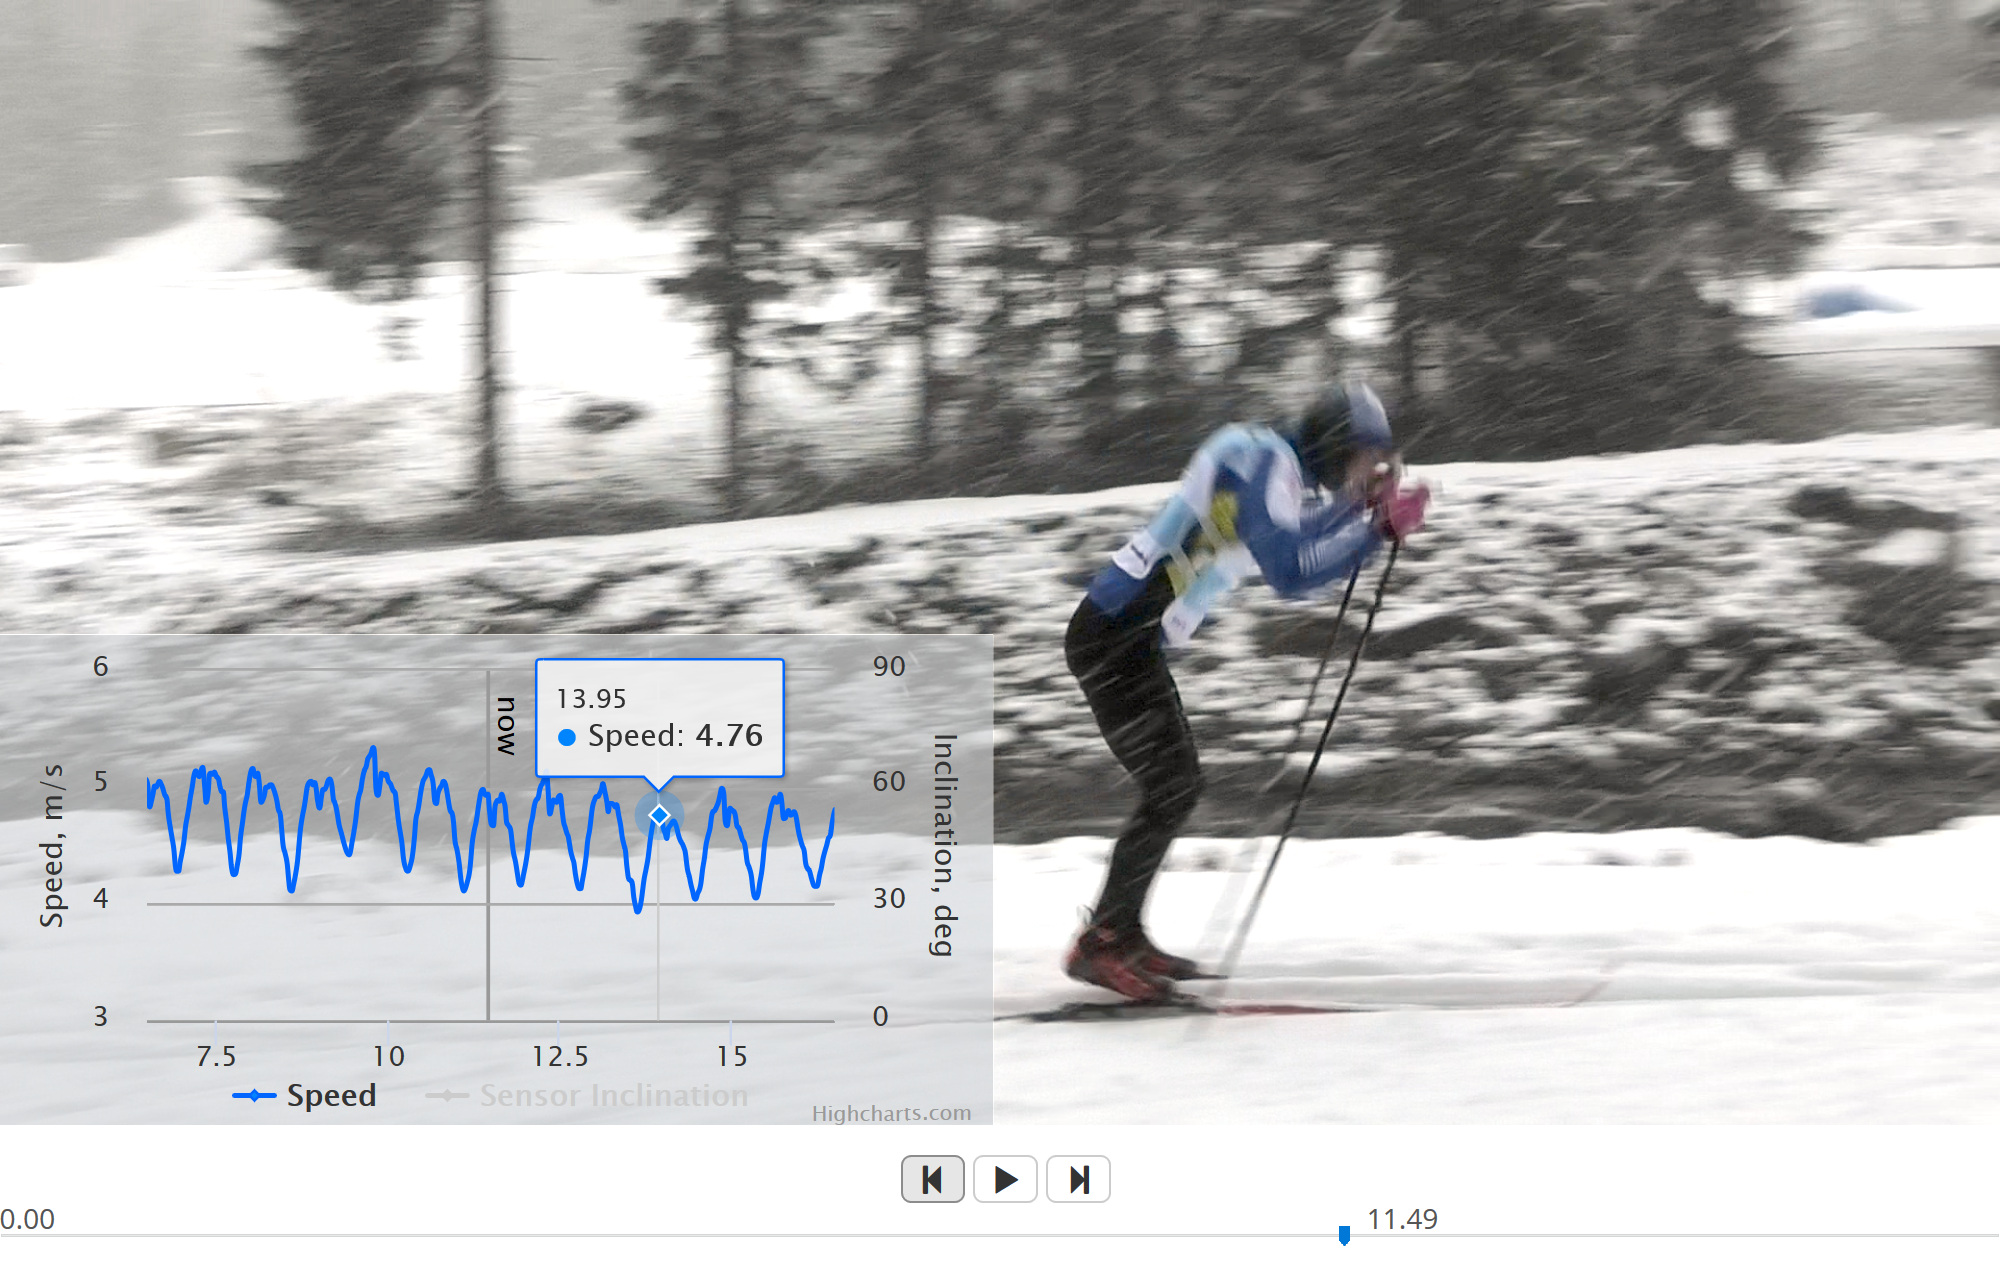
Video Analysis
For technique analysis and to understand how exactly an athlete's movement, respectively his technique, influences his performance videos can be added to the measurement. As mentioned above, videos are automatically synchronized, all you need is to upload the videos to our server. You can then visualize a single video or two videos synchronized side-by-side. The video player features slow motion and frame-by-frame display.
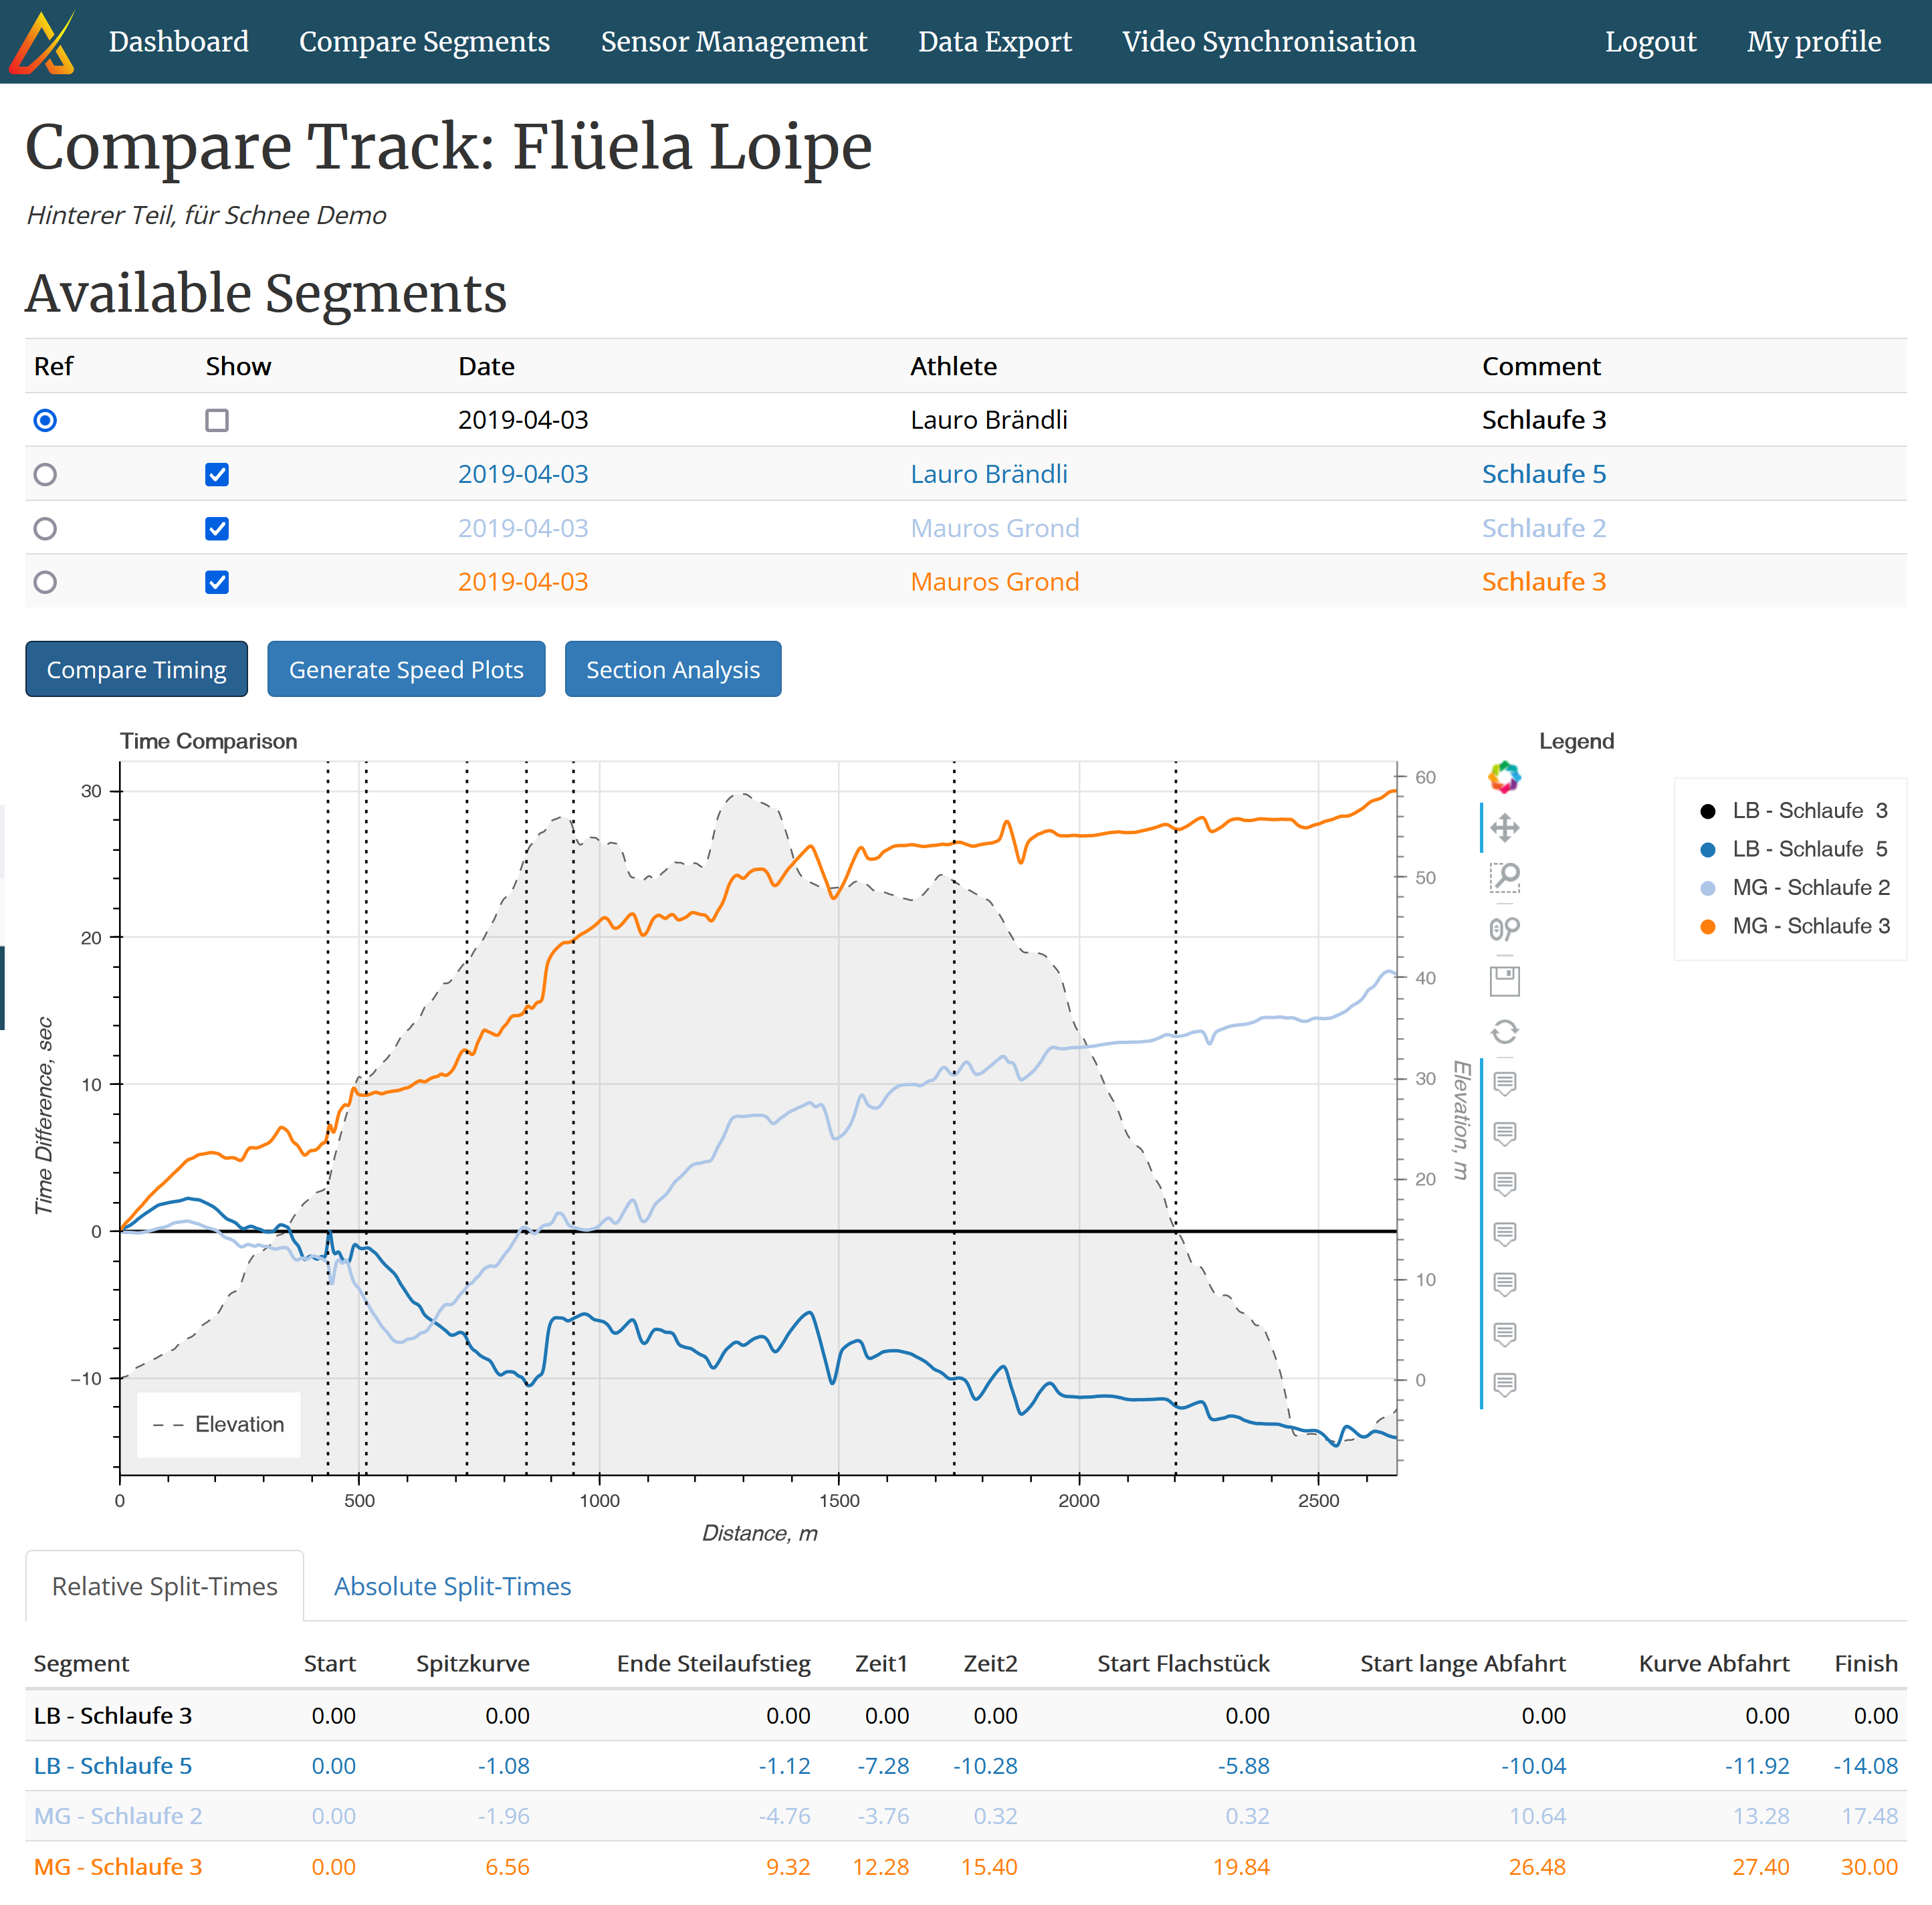
Lap comparison
With our lap comparison feature, any laps from any athletes can be compared with three clicks:
- select one lap
- select a second lap
- select the comparison option
Comparison options are:
- Continuous split times with a time waterfall plot
- Speed comparison with a sub-technique analysis
- Section analysis with section times and average cycle parameters
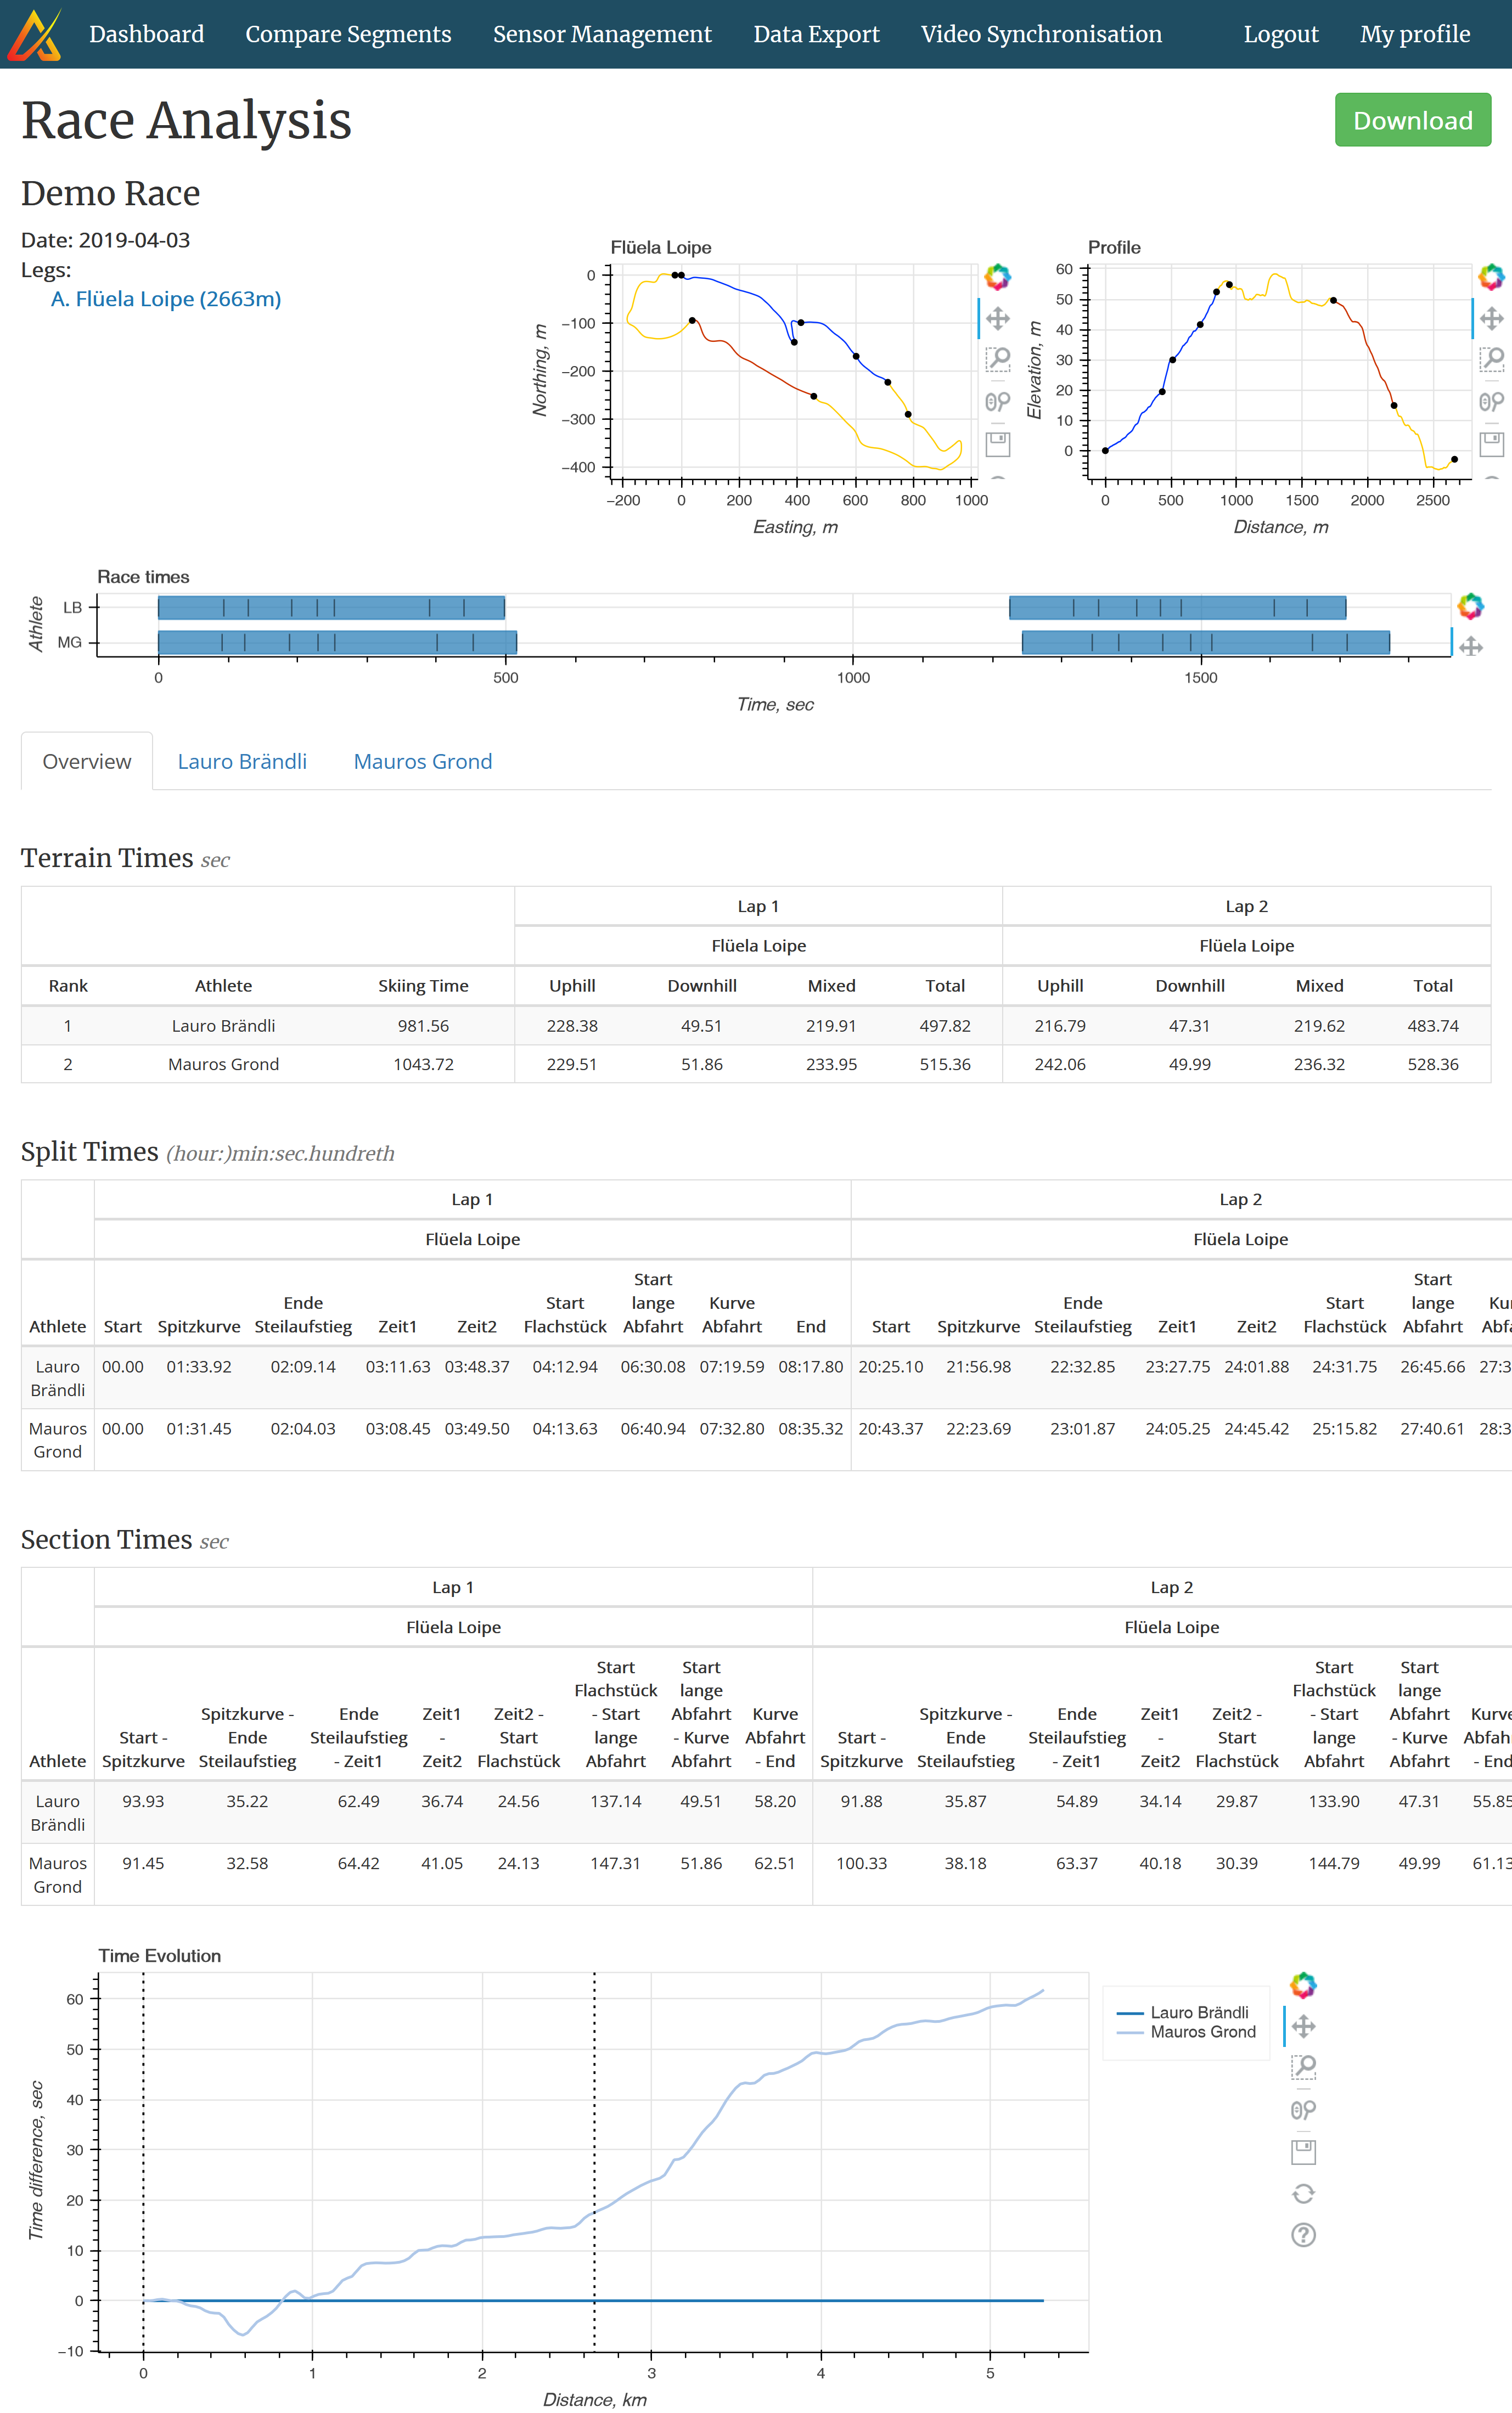
Race Analysis
The race analysis summarizes an entire training or competition on one page. The race report provides a split time analysis along with section times and an overall time waterfall plot, terrain statistics (how much time each athlete spent on uphill, downhill and flat sections, separated by laps), and speed and sub-technique comparisons against the fastest athlete. The race report can be downloaded as an HTML file and shared with other coaches and the athletes.
Conclusion
Within a very short time frame our system delivers an in-depth performance measurement of entire training sessions and even from competitions. Depending on your needs you can use the race analysis as an overview or go into details with interactive video analysis and the cycle-by-cycle view for a segment.
Need more info? Request an online demo!
You want to train efficiently? Order now!