Sprint Running: Quick Asymmetry Analysis
Asymmetry between left- and right-side movements in athletes is natural to some extent or may be indicative of a past injury. However, large left-right differences in performance metrics could in turn reveal a higher risk of injury over time. Though this last point is still debated, monitoring athletes' asymmetries might still be important to avoid a worsening of a disequilibrium over time and ensure an optimal performance. Here we are going to give you some insights into the possibilities that our solution offers on this topic.
Quick Asymmetry Visualization
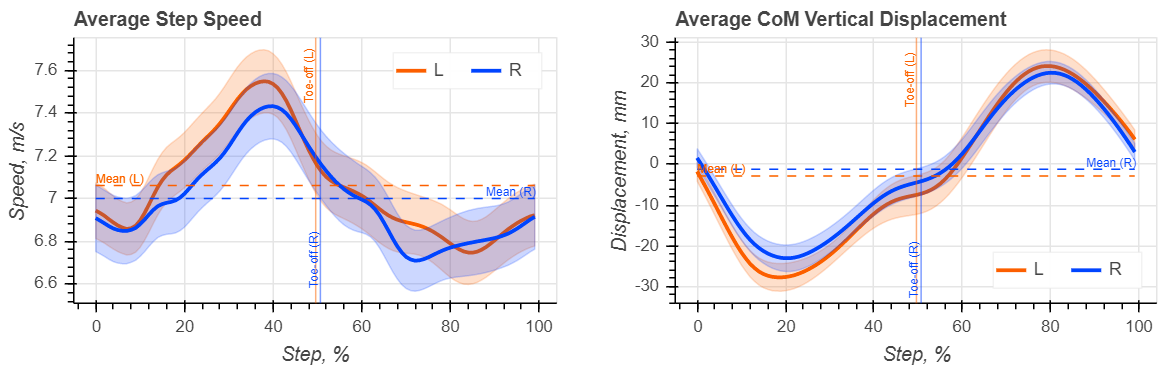
An easy way to observe these movement asymmetries is to look at the performance summary "waveform plots" on top of our segments' pages. These two plots respectively represent the step-normalized average step speed and average centre of mass (CoM) vertical displacement (almost equivalent to the hip vertical displacement). A step-normalized plot gives a rapid overview of the characteristic evolution of a parameter inside the steps no matter the speed regime of the athlete, as it removes the influence of the step duration on the considered parameter.
Here we present the data from a 300m sprint training of an elite athlete. Left-right differences can be seen directly on these plots (Fig. 1). Asymmetries can be seen both at the overall step means level and at the parameters' evolution level.
In-Depth Analysis
If we further analyse the evolution of the parameters inside the step cycle in this particular example, we can infer a relationship between step speed evolution and the hip vertical displacement.
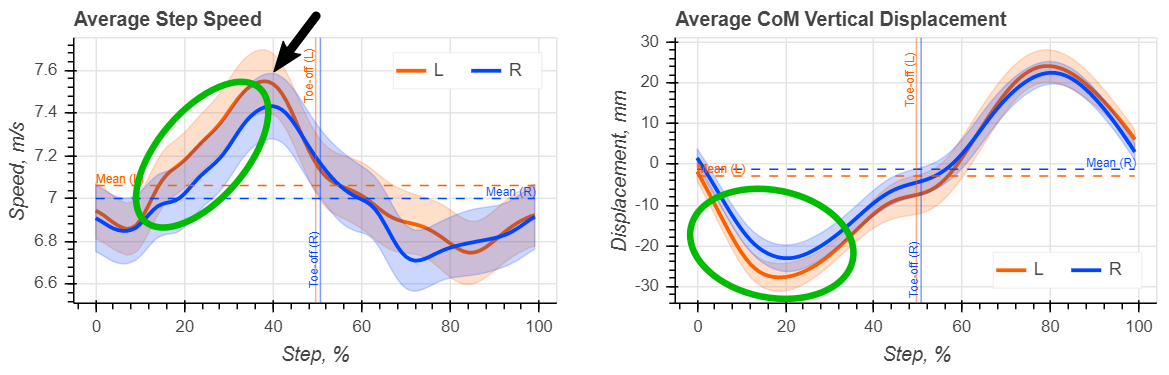
Indeed, on the first phase (green circle on Fig. 2), from 10% to 40% of the step, the athlete is generally able to produce a larger speed increase on the left side i.e., a stronger propulsion force. However, this is also linked to a larger hip vertical displacement on average for that same side, as compared to the opposite side. What follows is a rapid speed loss at around 40% of the step (black arrow on Fig. 2), which is most probably the consequence of the increased hip vertical play: the vertical work must be compensated at the expense of forward speed. And so, the final step becomes eventually very similar for both legs.
All in all, if we compare the global step speed mean of both sides we observe a relatively small asymmetry (~10%) in "favor" of the left step. The athlete gains on average more speed with his/her left leg, yet this movement appears less efficient as it requires more energy. This may lead to an increased fatigue or an increased compensation over time and might deserve a bit of attention, in the case those asymmetries would worsen with the training load or over the season.
Though it does not replace clinical and lab measurements, we saw in this rapid overview how our system can tell you about asymmetries during daily training without any extra effort. When monitoring their evolution over time, sudden changes may indicate a higher risk of injury and the training regime should be adapted accordingly.