Cross-Country Skiing Performance Analysis
Accurately track the athlete's movement during all his trainings
How does it work
- Switch the sensor on
- Wear it during practice or competition
- Our smart algorithms automatically detect, filter, and analyse all movement periods of interest
- Improve the performance based on the (live) feedback
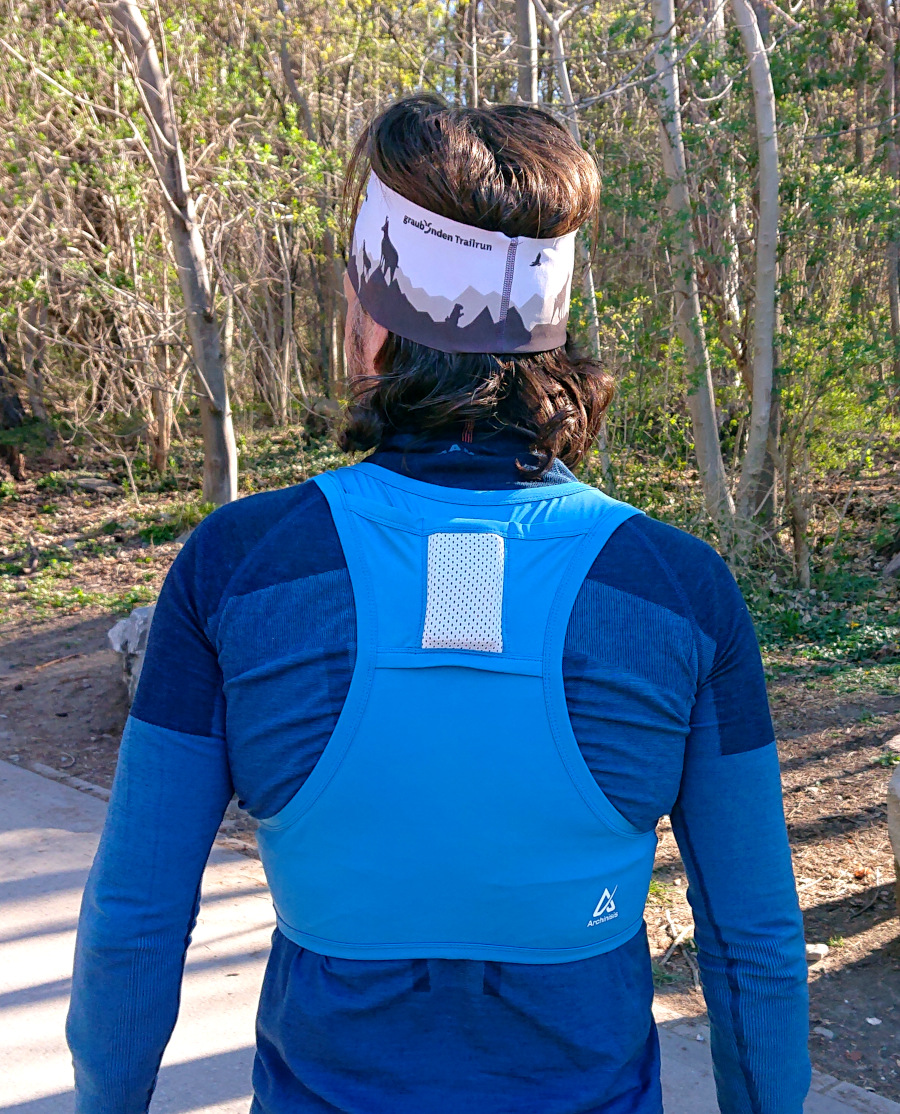
During practice and/or competitions the athlete wears our sensor on his upper back. We provide a specially designed shirt to hold the sensor in place. For highest accuracy and real-time feedback we recommend using our flagship Naos sensor.
With the Naos sensor, data can be instantly streamed to our analysis server and you can access the sport-specific performance data via your smartphone, tablet or computer. With the legacy Admos sensor all data is stored on the sensor itself and you have to download the data via USB after completing a training session or competition.
Our analysis server automatically scans the data for the segments of interest and proposes them for in-depth analysis. In addition of defining reference laps / rounds which are then automatically detected in the data, our system knows the exact coordinates of the shooting ranges and extracts this data for the shooting analysis. No need for a painful browsing through hours of data and manual selection of the start and finish of a segment.
For each segment selected for the in-depth performance analysis our advanced fusion algorithms take all raw sensor data and computes the center of mass kinematics (3D position, 3D speed, 3D accelerations, angles of the upper body in space, and 3D rotation speeds) 200 times per second. The sport specific performance feedback is then distilled from these 3000 data points and visualized such that our users can obtain instant, easy-to-understand, and actionable performance insights.
Performance Analysis Options
- Skiing power
- Speed overlay on videos
- Speed comparisons
- Continuous split times
- Section time analysis
- Cadence
- Distance covered per cycle
- Technique detection
Understanding Performance - from Macro to Micro
We have summarized all these parameters on a single page. On top of the page the continuous split times allow to quickly identify key areas of interest. Users can define "virtual" split times to do a traditional section analysis. Diving further in, the next plots show speed and cadence differences as well as the sub-technique used for each cycle. In the last part, for the "micro" analysis the user can interactively define short sections. For each chosen section 3D maps and satellite images show exactly the locations of each pole push and which sub-technique was used. Moreover, for every cycle, you can compare cadence, distance and speed.
This quick video shows you how this analysis looks like.
Skiing Power
Our specialized algorithms estimate the average skiing power for every cross-country skiing cycle. For all techniques and all sub-techniques. The power analysis is the perfect tool for working on the skiing technique: try out different adaptations in technique such as a different cadence, different work with the upper body, altered arm movement and much more and measure how this affects skiing power and efficiency. What adaptations allow you to ski the fastest with the least power requirement? Measure how much power you are missing to ski 1 km/h faster. Find out if it is worth to put extra effort in the two last uphill cycles to gain extra speed during the following downhill. Perform ski testing and measure which ski creates the least ski-snow friction and is therefore the fastest.
Interested to know how we estimate this average skiing power? Read our blog post Cross-Country Skiing Power
Video Analysis
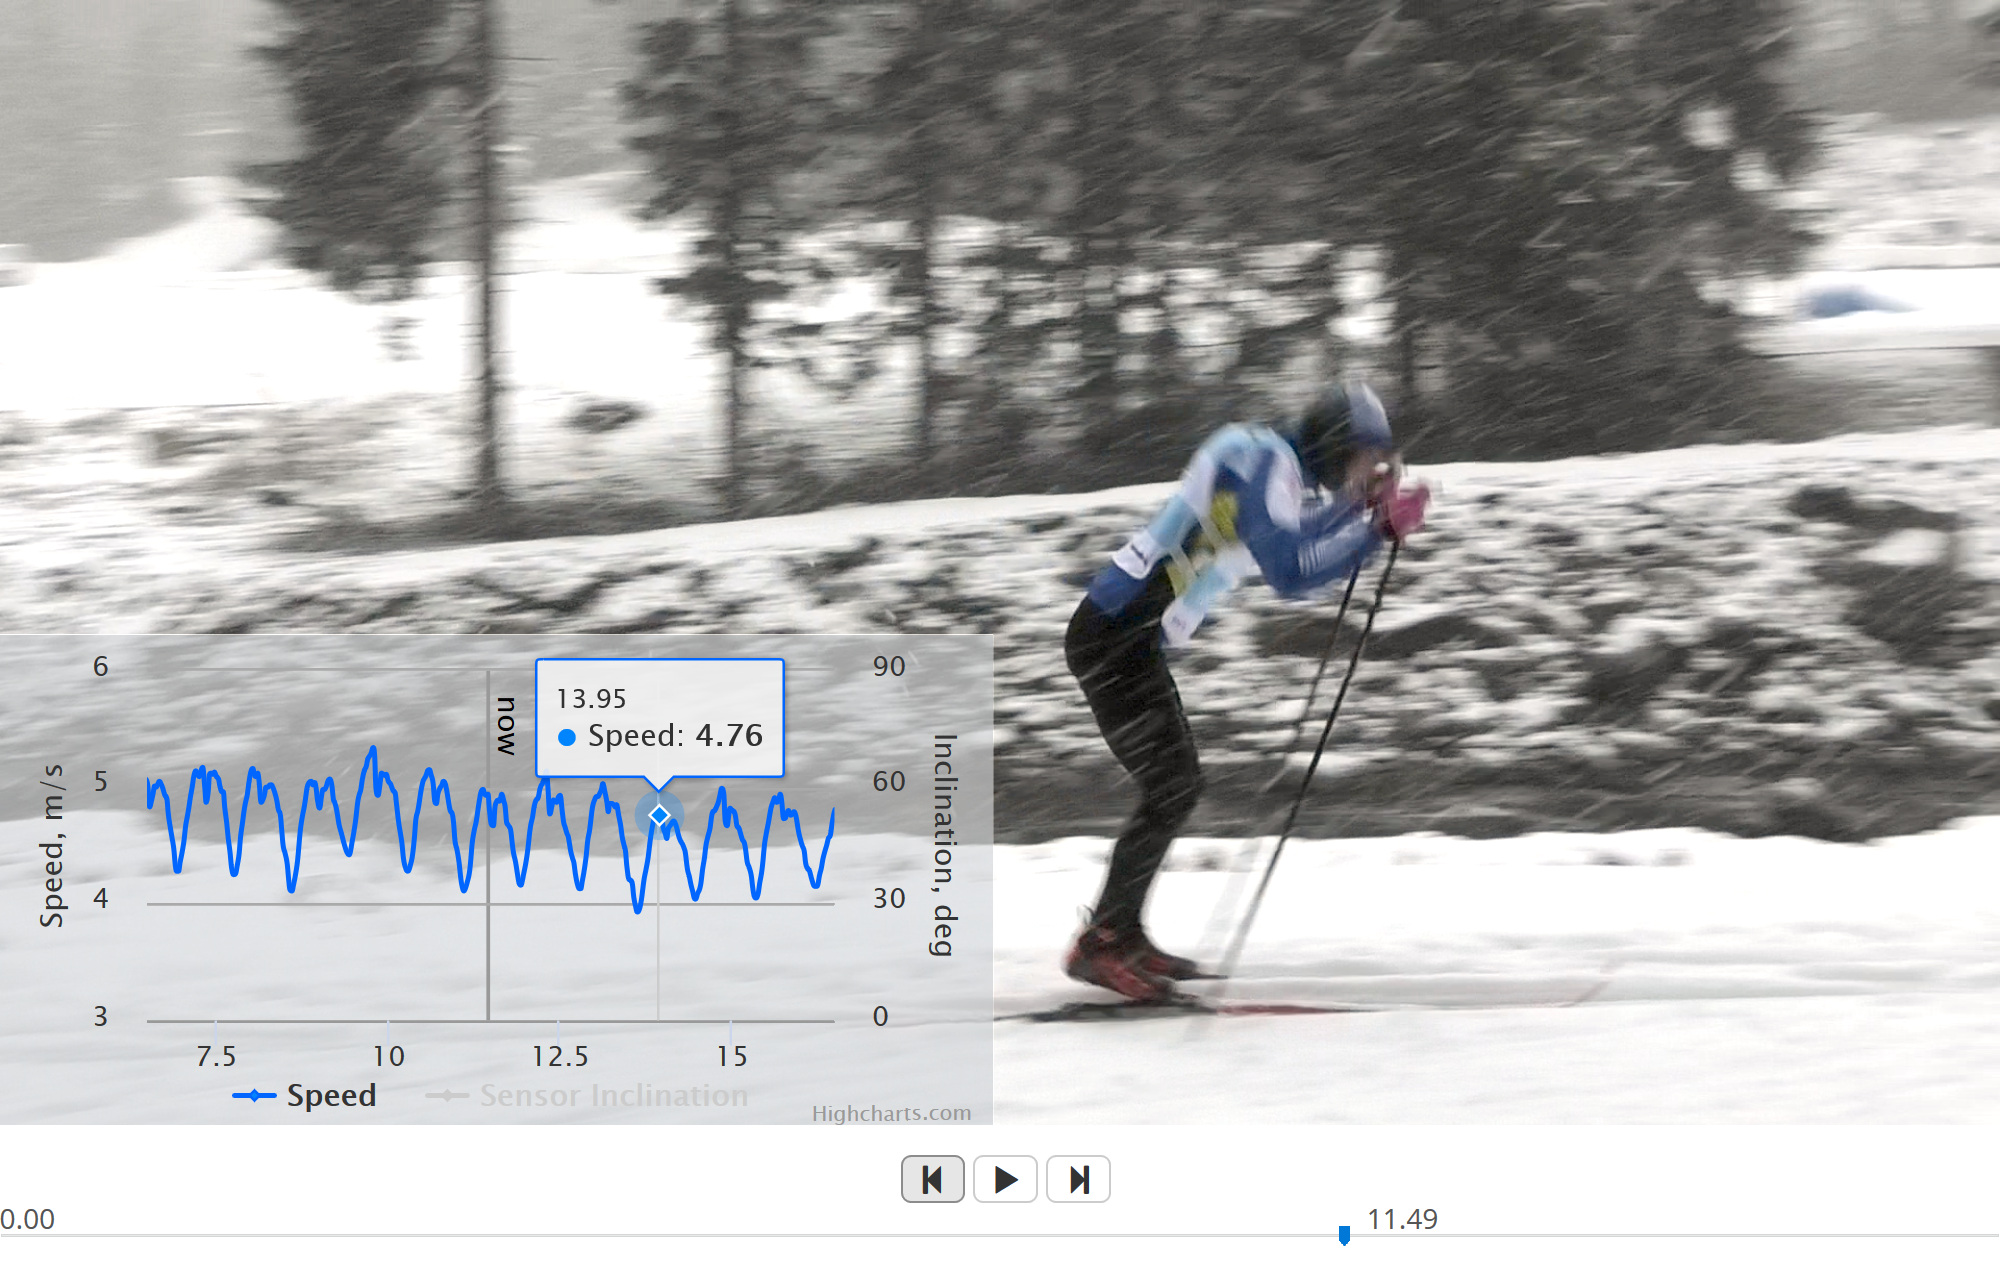
For easy interpretation of the performance data, for example for technique training, the synchronization unit allows to synchronize videos automatically with the data. Speed overlays on the video can thus be created automatically and help to browse through the data and understand better the performance of the athlete.
Performance Comparisons
Dedicated algorithms allow to obtain accurate continuous split times. Time differences between athletes and laps can be easily tracked over time with waterfall plots. Color-coded maps display the speed difference between any two laps, from the same or from two different athletes. Within seconds, each athlete's strenghts and weaknesses can be identified and progress tracked over time. Everything is web-based and no special programs are needed. Thanks to our special algorithms all the analysis is fully automatic and almost no user interaction is required!
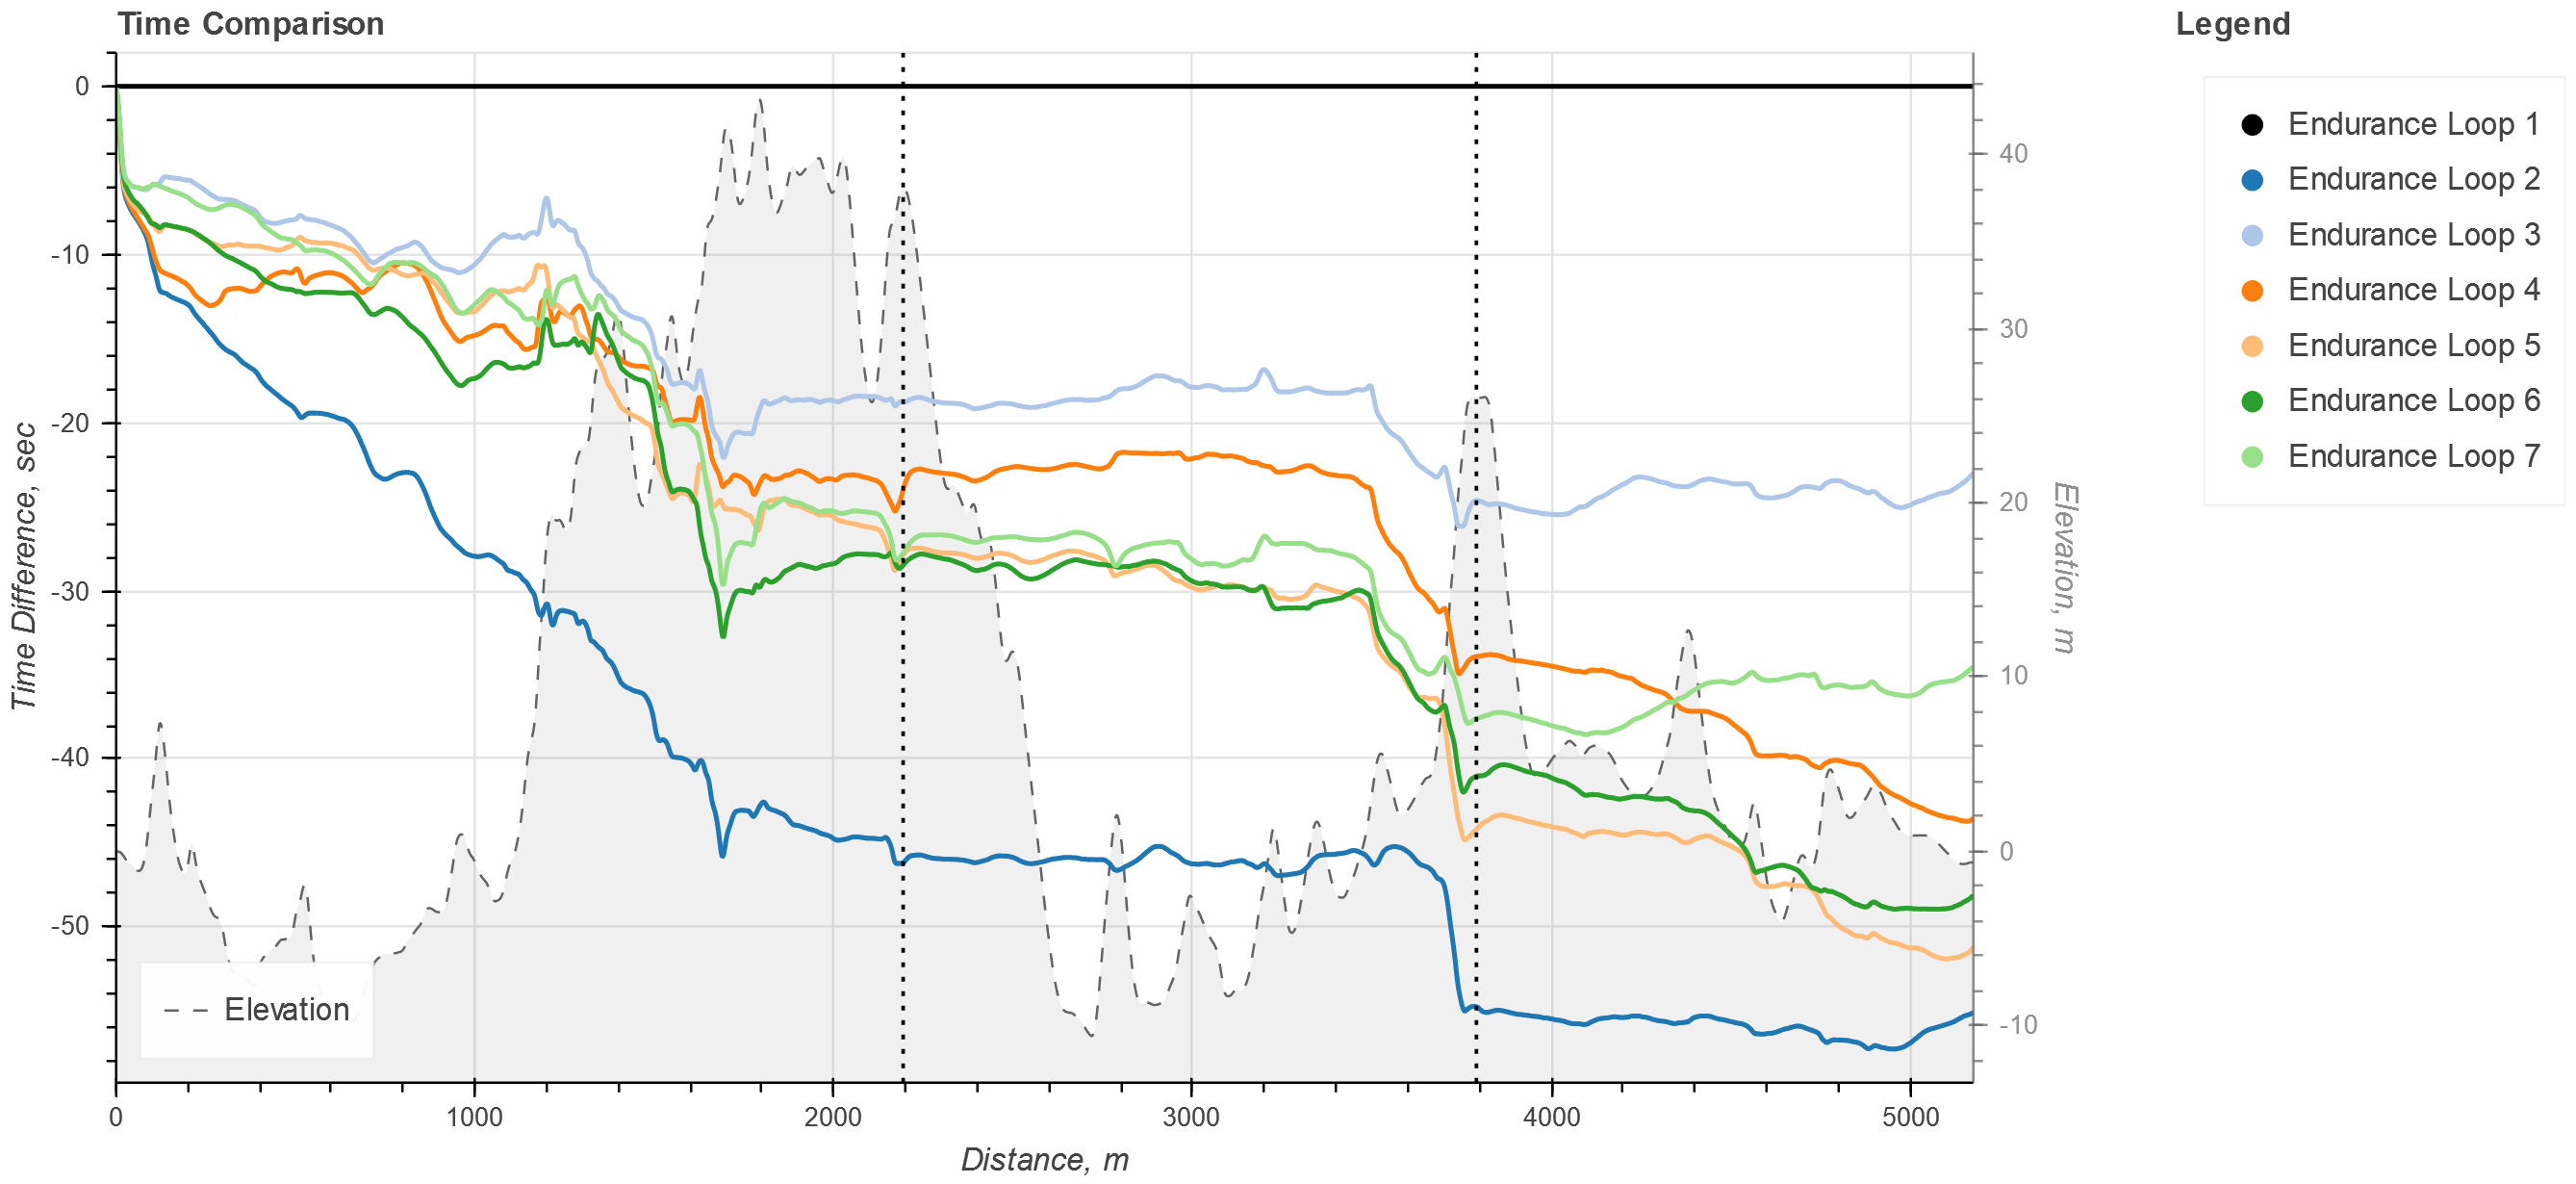
Waterfall plot of the continuous split times for 7 laps with the track's elevation profile in light grey. The frist lap (black) is the reference lap. Negative times mean faster skiing compared to the reference lap.
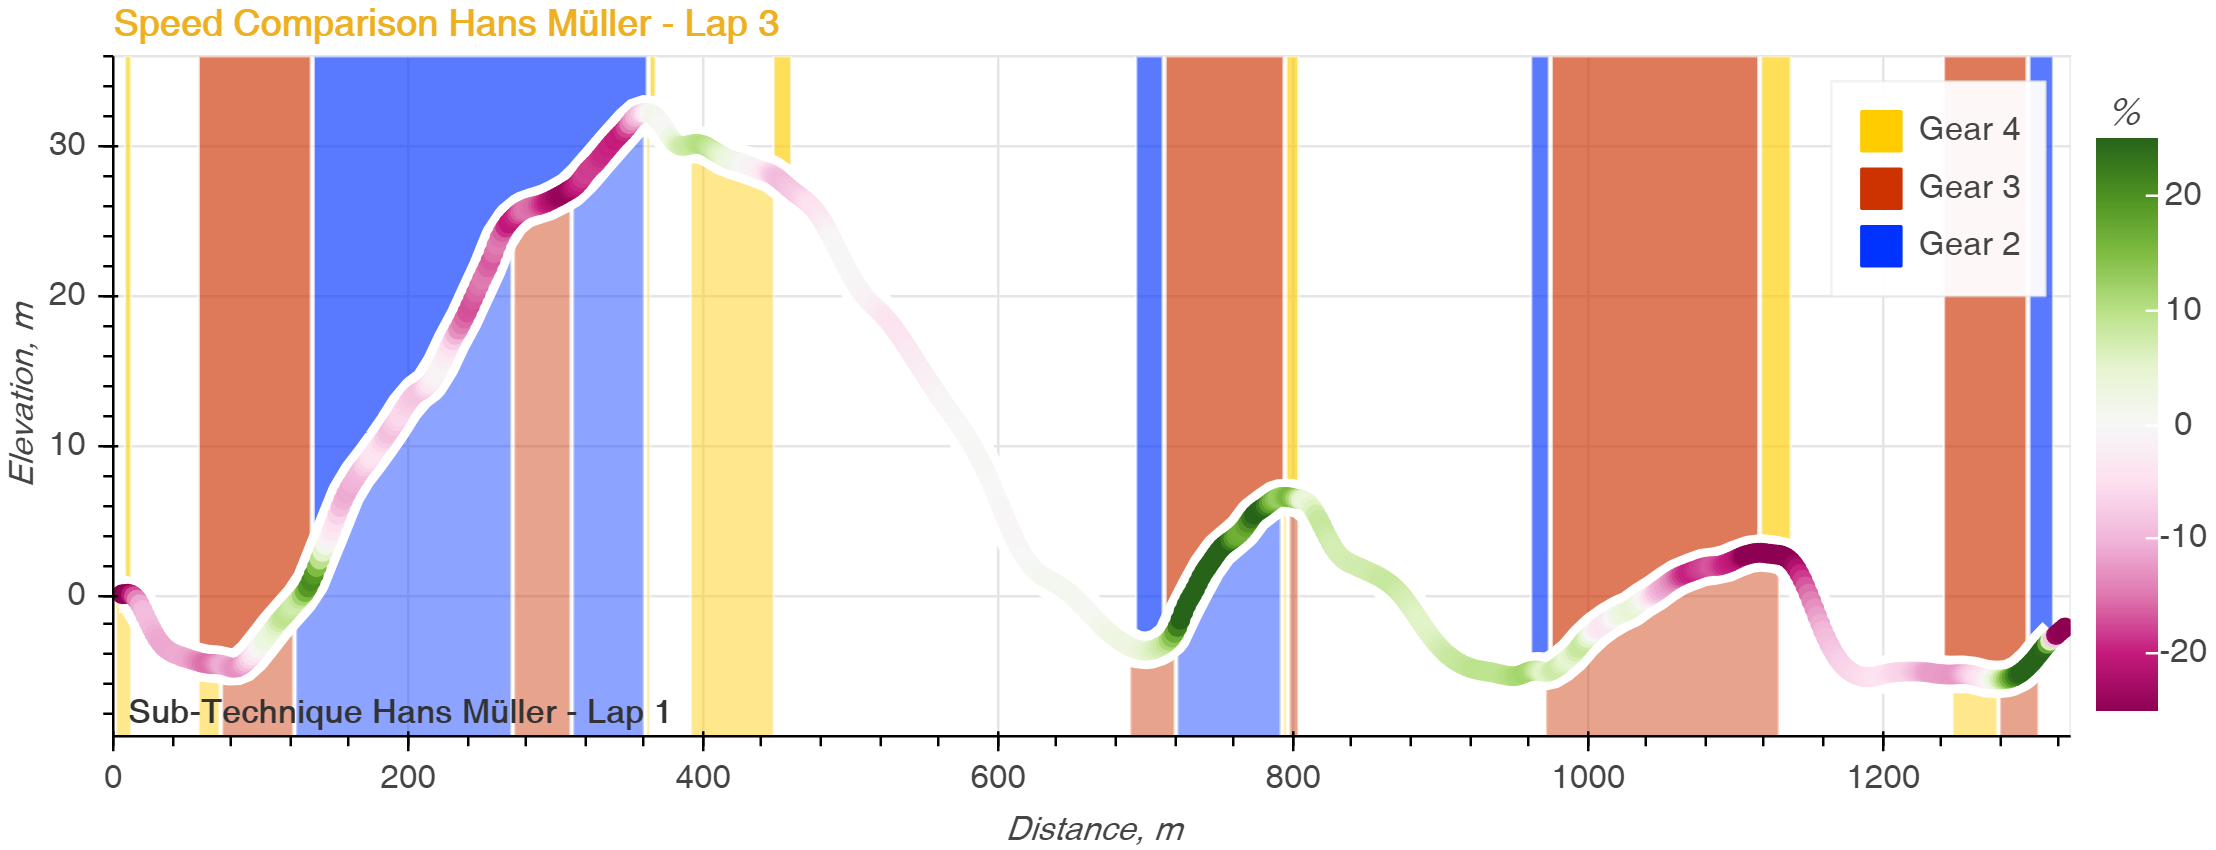
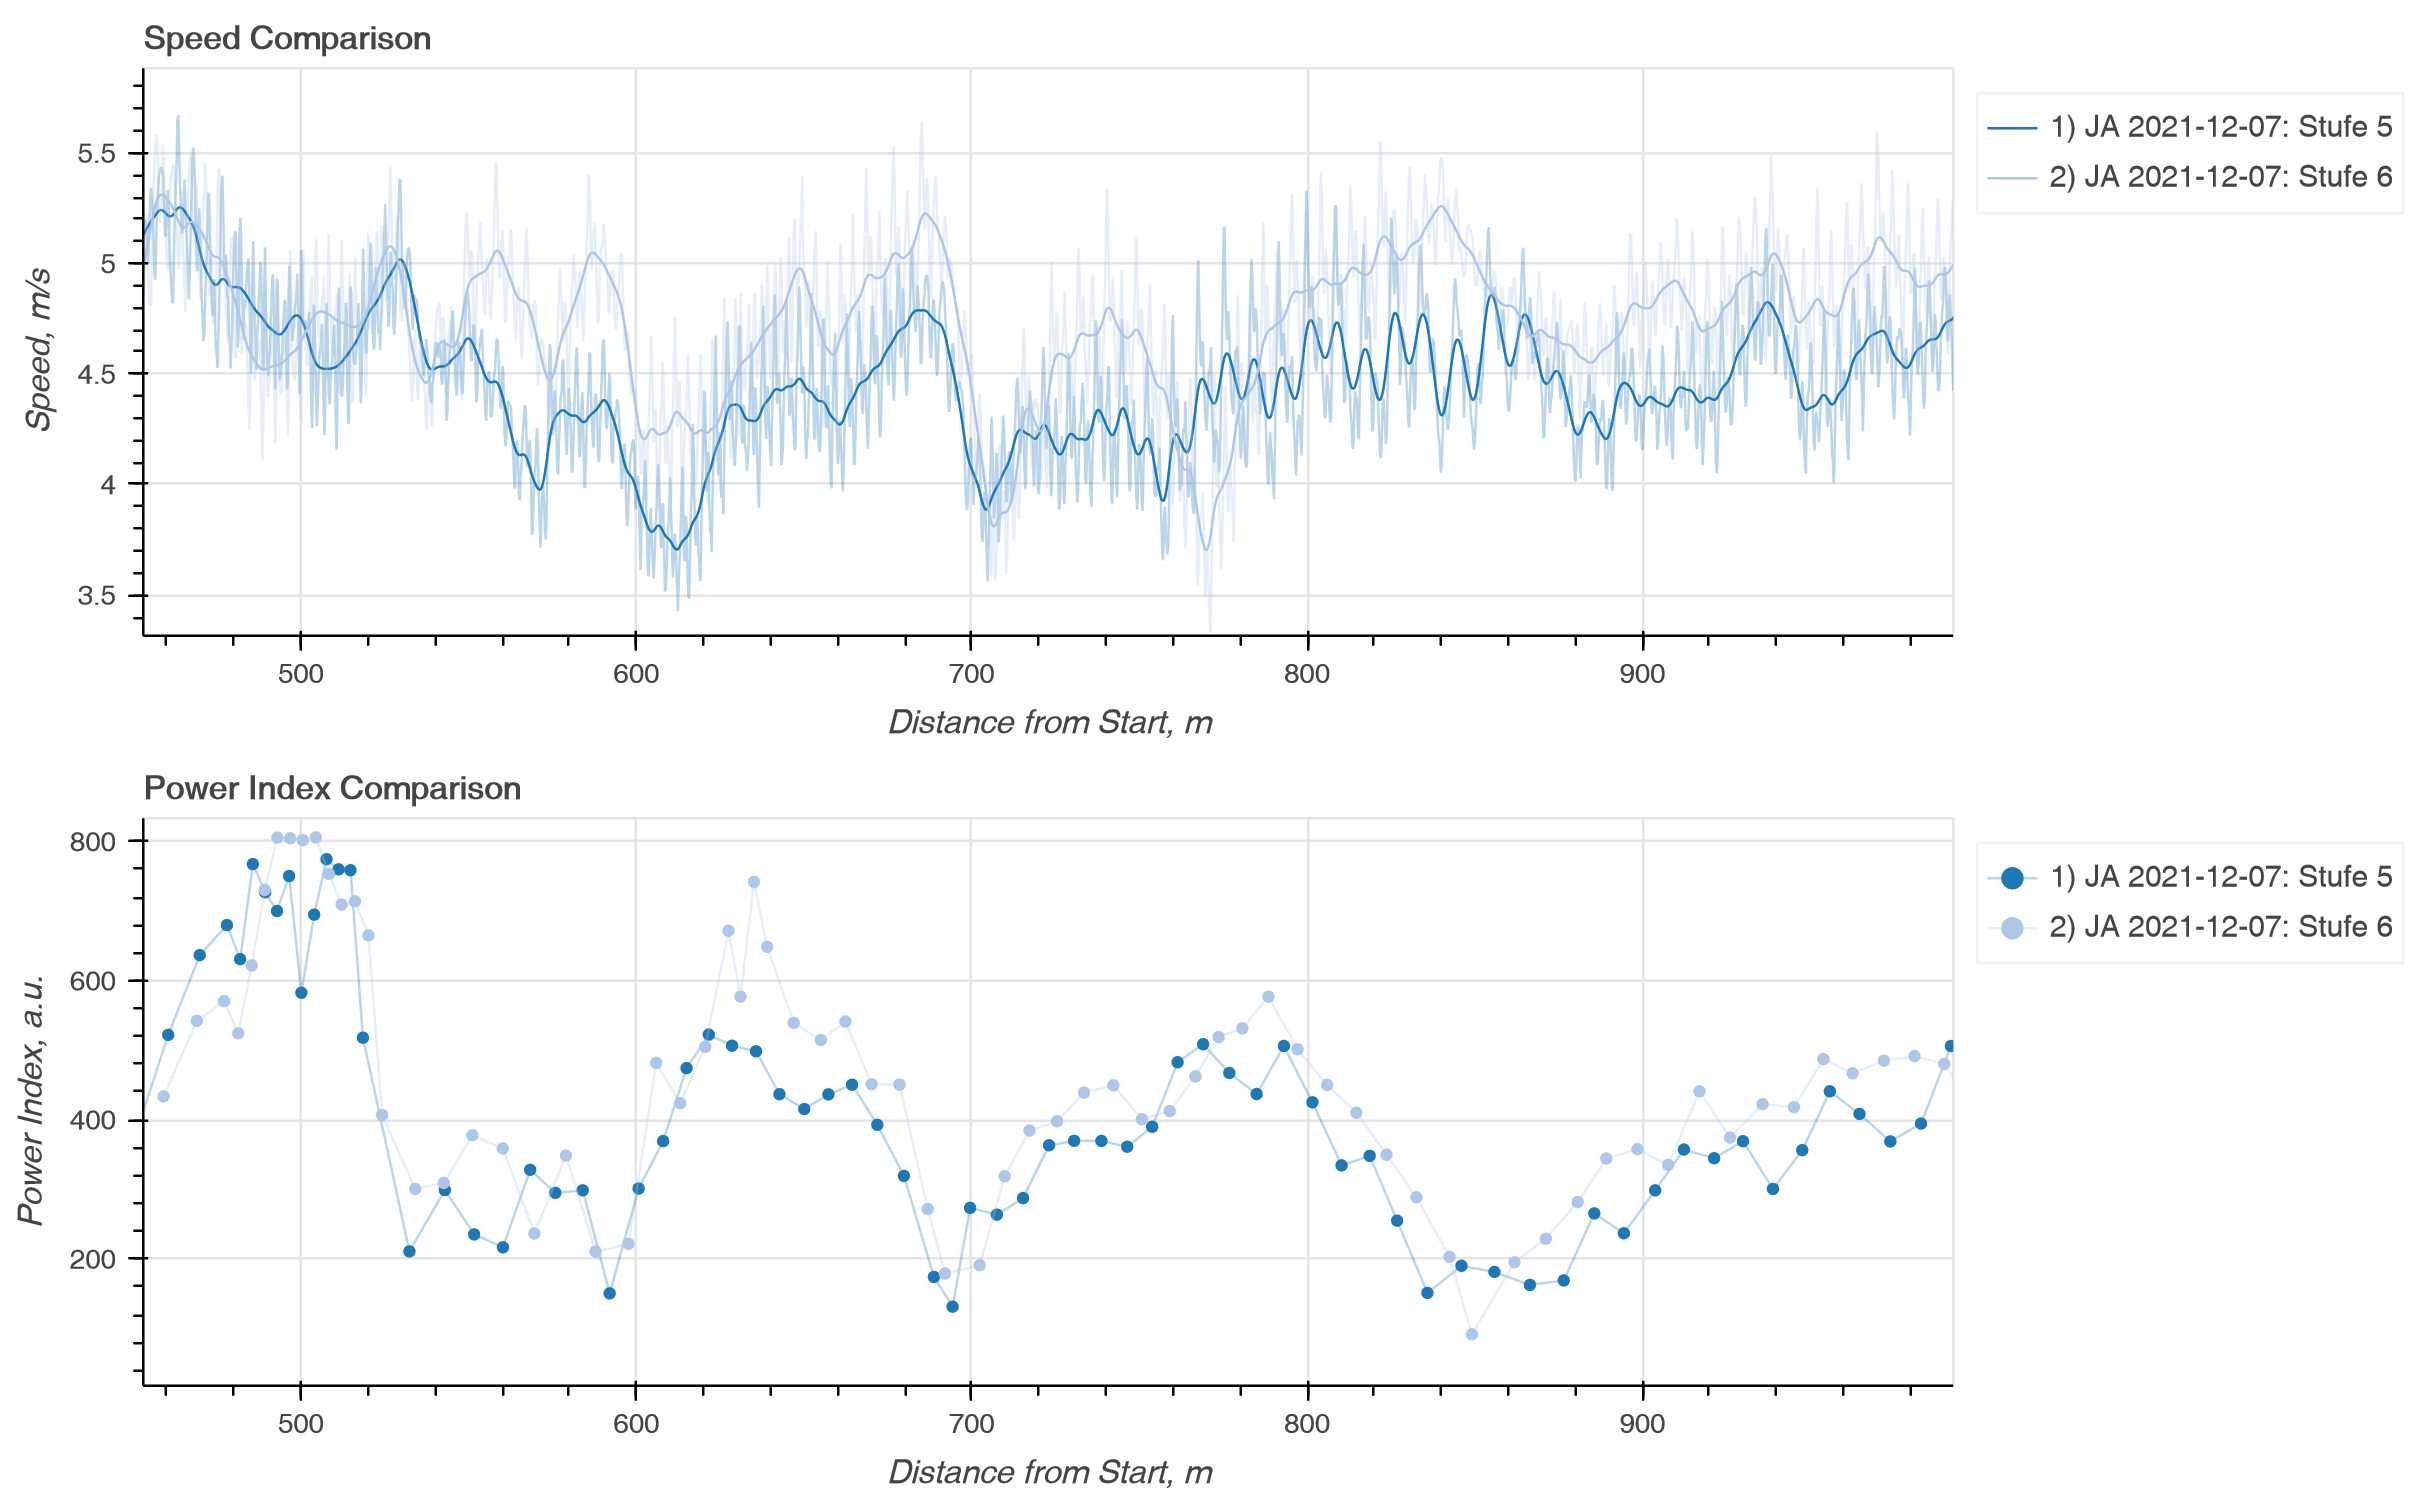
Race strategy analysis with the speed and sub-technique comparison plot. Identify in one glance which sub-technique is the fastest where. The color-coded elevation profile shows the relative speed differences between the two selected laps. Sub-technique is automatically detected.
Cycle Parameters
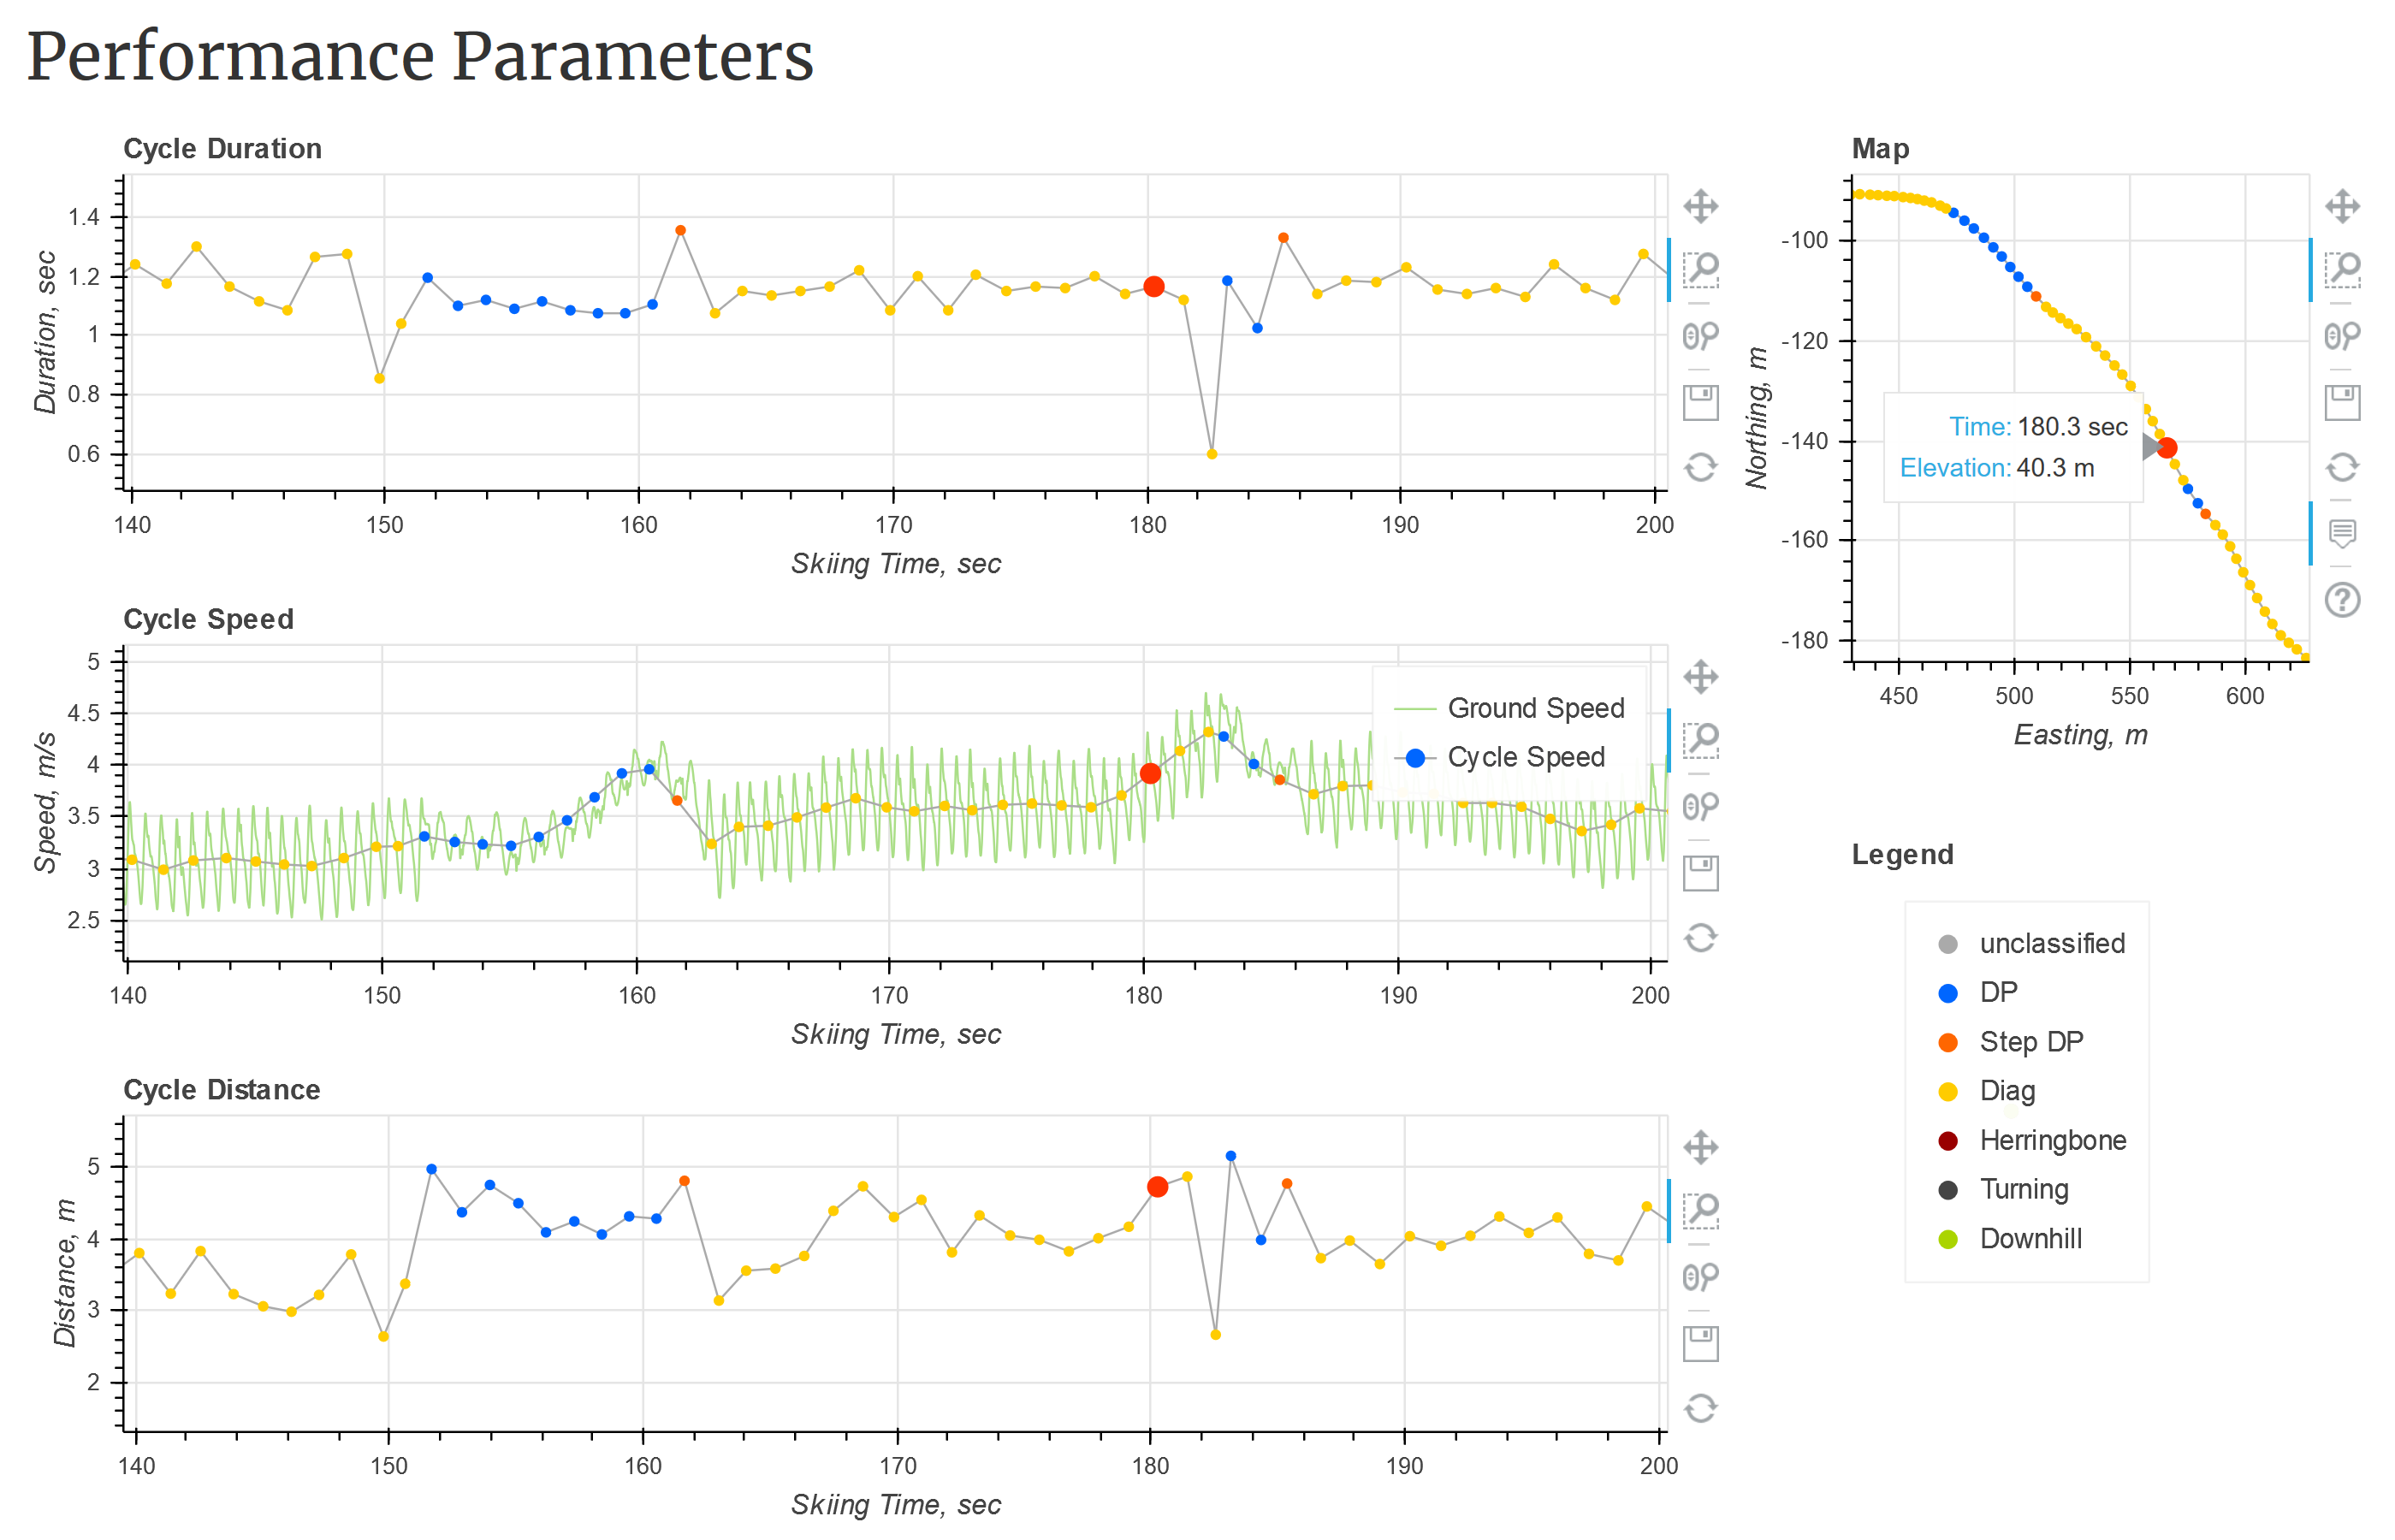
Using motion constraints our system precisely detects the beginning of each cross-country skiing cycle for both the skating and classic style. Combining that data with the center of mass kinematics obtained from our specialized fusion algorithm the system can then compute cycle duration, cycle speed, and cycle length.
Sub-Technique Classification
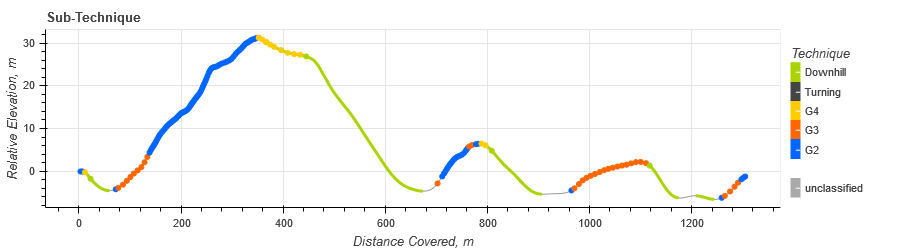
Biomechanical models and motion constraints allow us to automatically classify the sub-technique used for every single cycle. Whether it is classical cross-country skiing or skating, our algorithm is smart enough to know what you were skiing and will classify your cycles right. The skating sub-technique classification has been validated and showed an accuracy of over 98%. Read here the details.
And don't forget, everything is based on a single miniature sensor worn on the upper trunk. A truly unique system that nobody else can offer at this accuracy and precision!
Convinced? You want to understand performance and improve your training as well?