Why Sensor Fusion?
When talking to coaches and athletes I often get the comment: "With my GPS I already get 10 datapoints per second. It's already too much data for me to digest! I'm lost and don't know what to do with all this data".
This is true and I completely agree with these coaches and athletes. Yet, 10 datapoints is by far not enough to understand and explain performance. Especially when we want to look at the tiny details that make the difference between the athlete on the podium and the one on the fourth place. The devil is in the details: only there we can see the performance deficits the athlete has to improve.
Imagine you are measuring a sprint. Typically, the athlete makes around four steps per second, each step lasting 0.25 seconds. During just under half of this time, the foot has contact with the ground and can create the force necessary to sustain or increase his speed. If we have 10 datapoints per second from our GPS, we get 2-3 data points per step (Fig. 1). Only 1 during ground contact. Imagine now that the athlete's left knee is a tiny bit weak and bends slightly more at the foot strike. This happens maybe during 0.05 seconds. Most likely we don't have any datapoint from this moment: his weakness is impossible to detect. Thus, a GPS is clearly not enough and we need something better (interpolation is useless here: have a look at the Nyquist-Shannon sampling theorem to understand why).
GPS is not enough. What else could we use?
Inertial sensors may be the perfect solution: they measure acceleration and angular velocity many hundred times per second. And we all know from our high-school math classes that speed can be computed from acceleration. However, in practice, this is not trivial because of the so-called integration drift (I wrote my PhD thesis on this topic and was by far not the only one working in this field...). We need something that can be used to correct this drift.
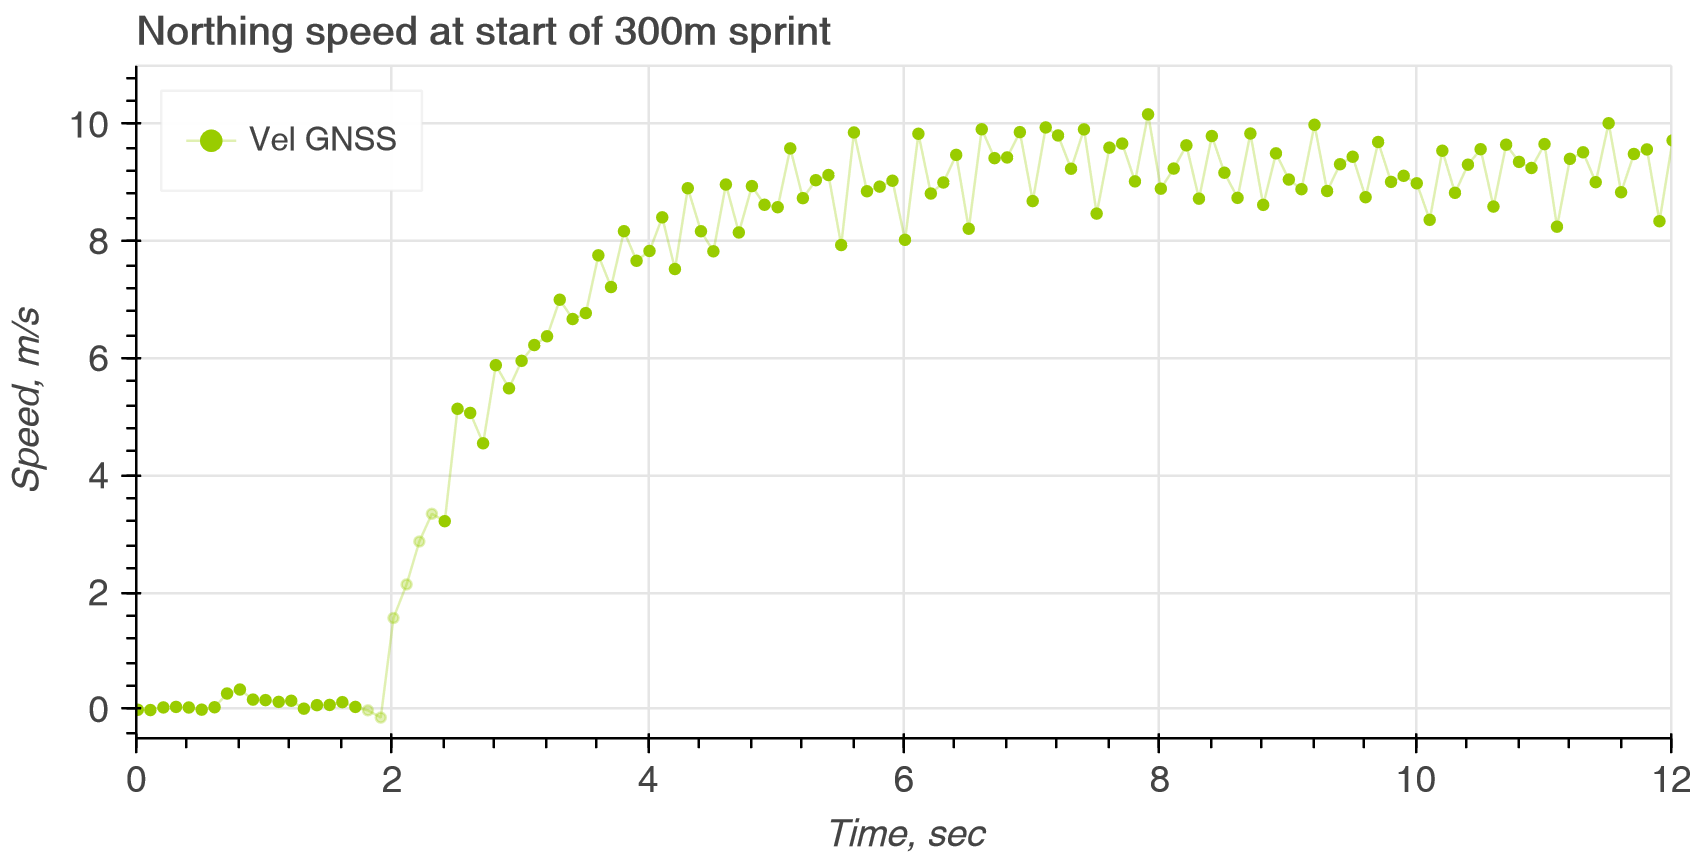
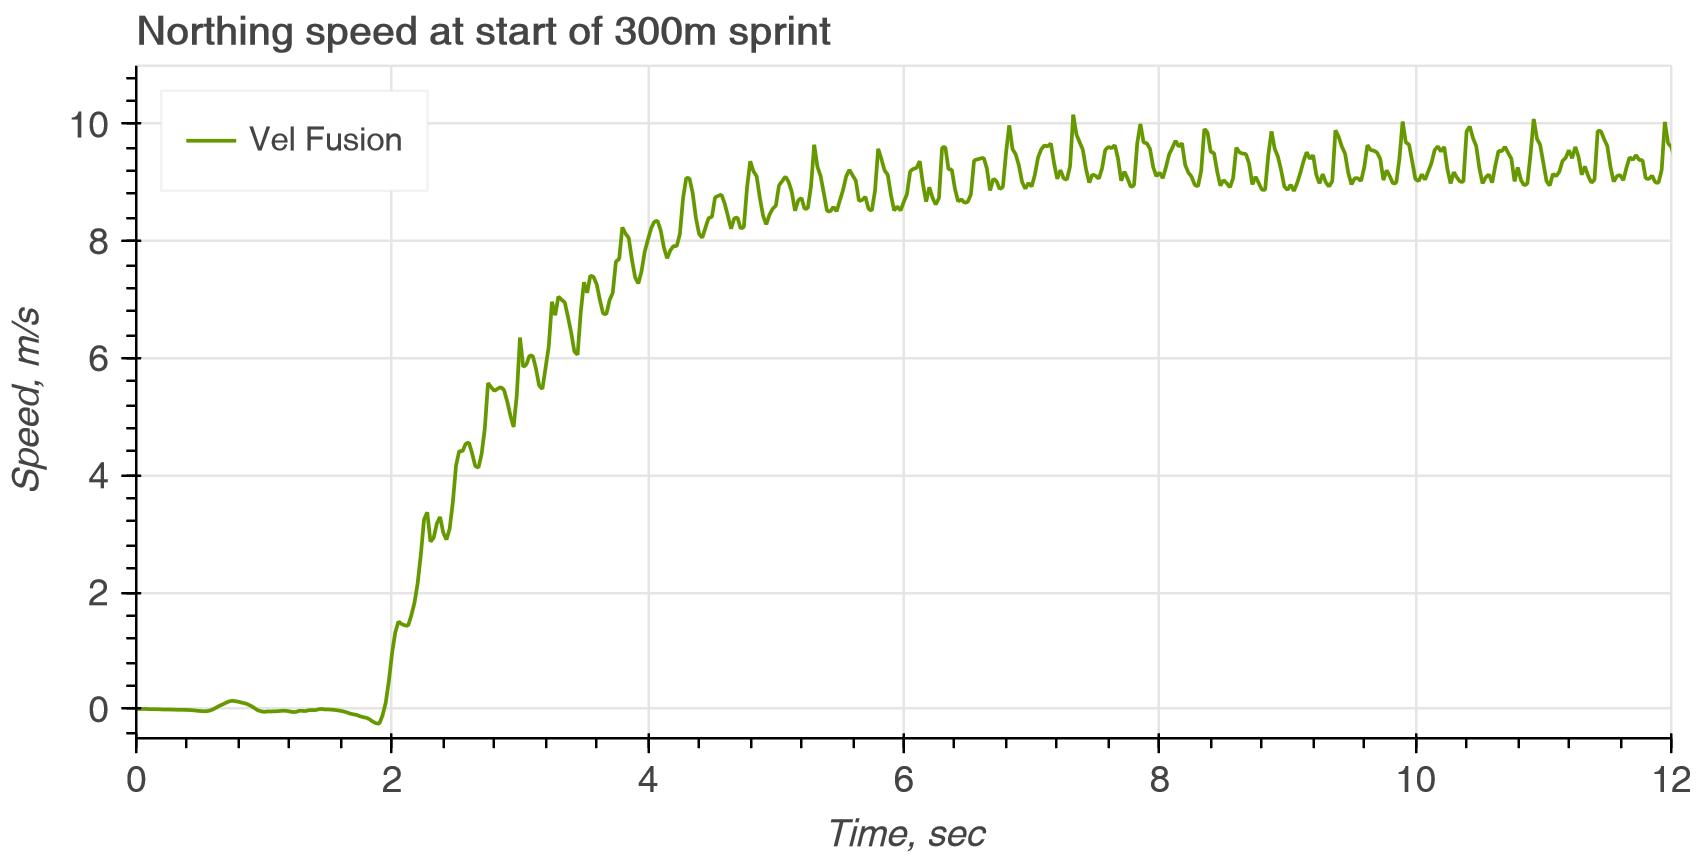
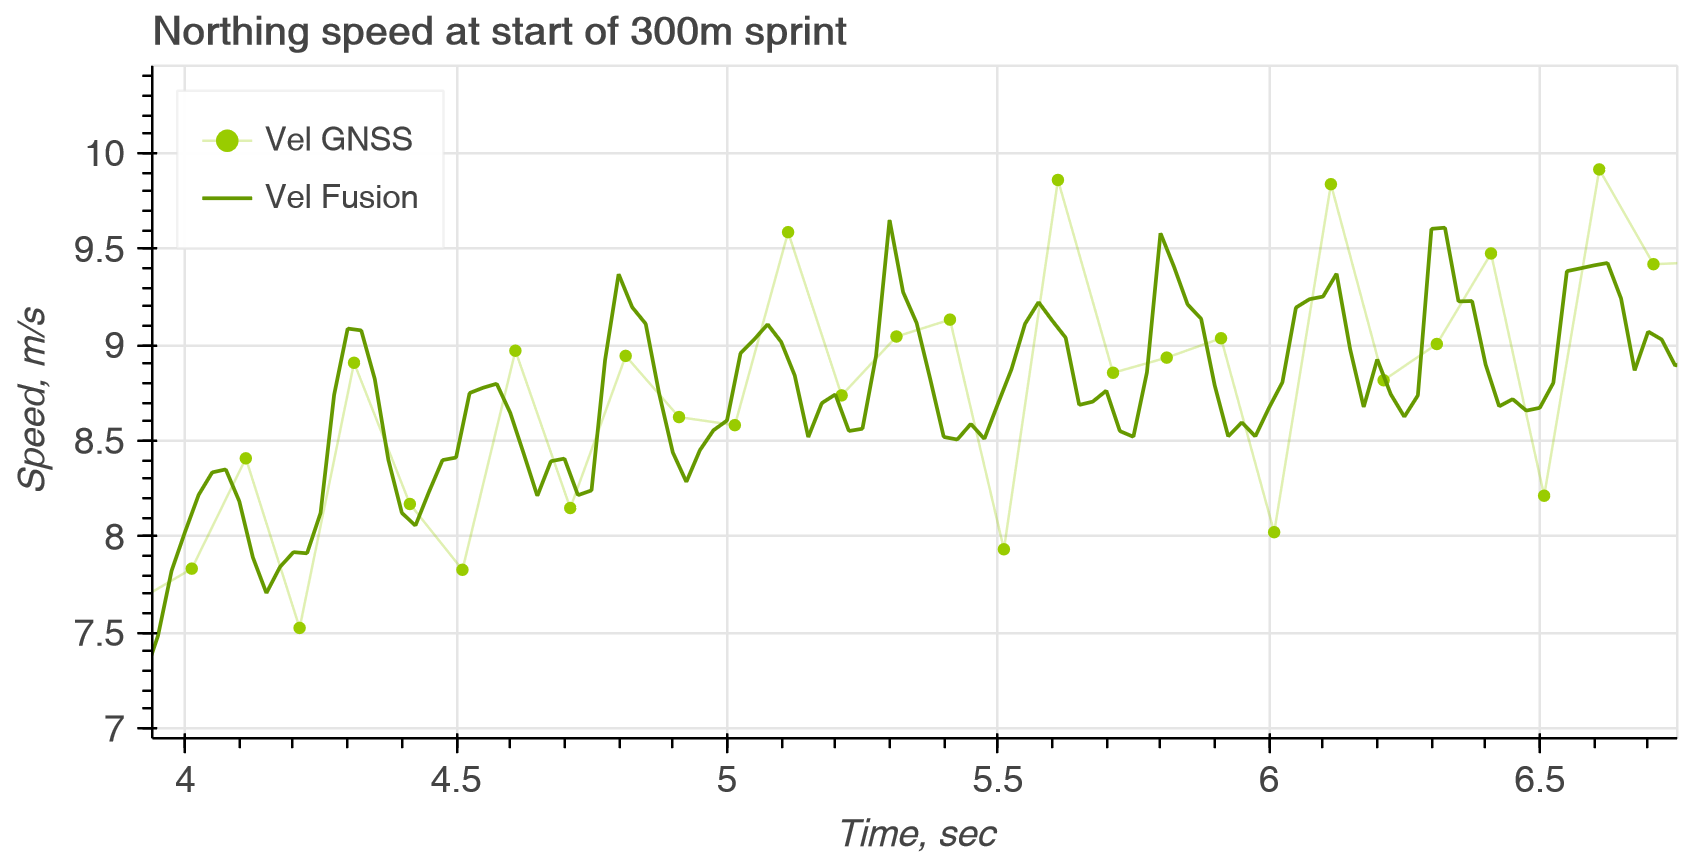
Sensor fusion does the magic "trick" here: the inertial sensor data is put together (i.e., fused) with the data coming from a GNSS sensor (a sensor that is able to measure different satellite navigation systems (e.g., GPS, Galileo, GLONASS, BeiDou) simultaneously). GNSS data is used to correct drift from the inertial sensors and inertial sensor data is used to correct inaccuracies in the satellite data. Moreover, using the inertial sensor data increases the time-resolution. A win-win situation (see Fig. 2 and 3).
Key Performance Parameters
Now we have speed and position data many hundred times per second and, if we are smart (we may need some biomechanical model to compute the centre of mass kinematics, more of this in another article), are able to measure the athlete’s performance deficits. The only challenge remaining is how to visualize the data: we need to extract certain parameters, do some smart data summarizing, etc. Once we have done this, the coach obtains 2-3 key performance parameters per measurement, can compare them, and can use them to efficiently improve the athlete’s performance.
The coach is no longer lost in too much data: the sensor fusion allowed first to go into the details, extract key performance parameters and then take a step back again. Instead of continuous, difficult-to-interpret raw-data, we have processed data, summarized in easy-to-understand performance parameters.
Archinisis offers such analyses for alpine skiing, athletics, biathlon, cross-country skiing, and soon ski jumping. Contact us to learn more about each solution and how we process and analyse the data!