Rowing Performance Analysis
The most versatile system to track rowing
From acceleration patterns, stroke parameters to training summaries: we've got you covered. Including real-time streaming and feedback. All with one single sensor on the boat and applicable to all boat classes. Used by national teams and high-performance university teams.
How does it work
- Switch the sensor on
- Place it on the boat, measure training and race
- Our smart algorithms automatically detect, filter, and analyse all movement periods of interest
- Improve the performance based on the (live) feedback

During practice and/or competitions the sensor is fixed anywhere to the boat's hull, ideally somewhere it cannot fall off and disappear in the water. For highest accuracy and real-time feedback we recommend using our flagship Naos sensor.
With this Naos sensor, data can be instantly streamed to our analysis server (via 4G), and you can access the sport-specific performance data via your smartphone, tablet or computer, from anywhere on the planet. In the offline mode, all data is stored on the internal memory and is uploaded to the webapp after practice and/or competition. In this offline mode, Naos is allowed to be used during competitions but teams/federations need to register its use with World Rowing.
Our analysis server automatically scans the data for the segments of interest (e.g. 2k or 5 minute pieces) and proposes them for in-depth analysis. No need for a painful browsing through hours of data and manual selection of the start and finish of a segment.
For each segment selected for the in-depth performance analysis our advanced fusion algorithms take all raw sensor data and computes the center of mass kinematics (3D position, 3D speed, 3D accelerations, angles of the upper body in space, and 3D rotation speeds) 200 times per second. The sport specific performance feedback is then distilled from these 3000 data points and visualized such that our users can obtain instant, easy-to-understand, and actionable performance insights. There is also no need for calibration of the sensor or aligning it with the boat: our magic takes care of this in the background.
Realtime Feedback
Real-time performance data can be streamed from any number of boats to any number of coaches being anywhere on the world. The sensor on the boat connects automatically via 4G and streams all raw data to our dedicated real-time server where the data is processed and forwarded to the real-time interface.
This means there is no distance limitation between the coaches' boats and the rowers and no extra device is needed. No hassle with Bluetooth syncing and loosing connection. The only requirement is a stable 4G connection throughout the entire rowing course.
- Stroke rate
- Pace in min:sec per 500m and percent of prognostics
- Distance per stroke
- Boat speed
- Total distance covered so far

Smart Segmentation
For the in-depth analysis you only want to look at the important pieces, excluding for example warm-up and cool-down. For this purpose we invented the smart segmentation procedure which automatically detects all pieces of relevance.
Each segment can be marked individually for in-depth analysis. Additionally, for advanced statistical analyses, you can enter weather and water conditions and select the crew.

Segment Overview, Boat Classes and Crews
Each measurement is assigned to a boat class to automatically obtain the correct world best time and compute the corresponding prognostics. Moreover, each segment (e.g., rowing piece) can be assigned to a different crew, allowing rapid analysis and comparison of what crew composition rows best.
Segments can be rowed in buoyed courses or in "free" lines: we automatically recognize this and compute the pace information accordingly: either as if a perfectly straight line was rowed or by using the effectively covered distance.
Our app provides overviews for each segment, including the used prognostic, total time, pace, distance covered, stroke rate and 500m splits:
Prognostic
| Time: | 06:30.69 / 2k |
| Pace: | 01:37.67 / 500m |
| Speed: | 5.12 m/s |
This Segment
| Total time: | 08:23.60 |
| Pace (eff.): | 02:05.47 / 500m (77.8%) |
| Speed: | 3.99 m/s |
| Distance: | 2000.0 m / 2006.7 m |
| Avg. Rate: | 20.4 ± 0.5 Str/min |
500m Splits
| 500m | 1000m | 1500m | 2000m | |
| Total time: | 02:05.59 | 02:04.67 | 02:04.93 | 02:06.81 |
| Pace: | 77.8% | 78.3% | 78.2% | 77.0% |
| Avg. Speed: | 3.98 | 4.02 | 4.00 | 3.95 |
| Avg. Rate: | 20.0 | 20.5 | 20.4 | 20.6 |
Stroke Parameters
- Stroke rate
- 500m time
- Prognostic speed (in percent of world best time)
- Absolute speed (in m/s)
- Distance covered per stroke
- Check duration (the amount of time in negative acceleration around the catch event)
- Speed changes (the difference between maximum and minimum instantaneous boat speed inside one stroke)
These parameters are displayed in six different plots, each showing the stroke rate in gray in the background. Further, the parameters are colored differently based on distance covered, allowing a fast understanding whether things are changing over time, for example due to fatigue. Each tiny dot is one stroke.

Parameter correlations / relationships
Separate plots show the speed and distance per stroke with respect to stroke rate, uncovering the relationship between these parameters.

Comparing multiple segments
These parameters can also be compared between different segments further improving the understanding of how each boat or crew is performing and finding the optimal setup. Increased speed or stroke distance for the same stroke rate allows inference about the rowing power and efficiency. The influence of wind and currents can also visibly affect these correlations / relationships.


Splits
For people preferring to work with numbers split tables are shown with splits taken automatically every 50 m or 100 m, depending on the total distance covered of a segment. Each split shows the average stroke performance parameters.

Speed and Acceleration Patterns
The rowing analysis allows a full in-depth view of the performance. It is possible to investigate the speed and acceleration curves, providing insights in rowing technique and synchronization. Moreover, the acceleration flag shows changing acceleration patterns over time, because of fatigue, for example.

Boat speed (blue line) and acceleration (red line). The black vertical lines mark the start of each stroke. The catch happens slightly before the acceleration minimum before each stroke start.
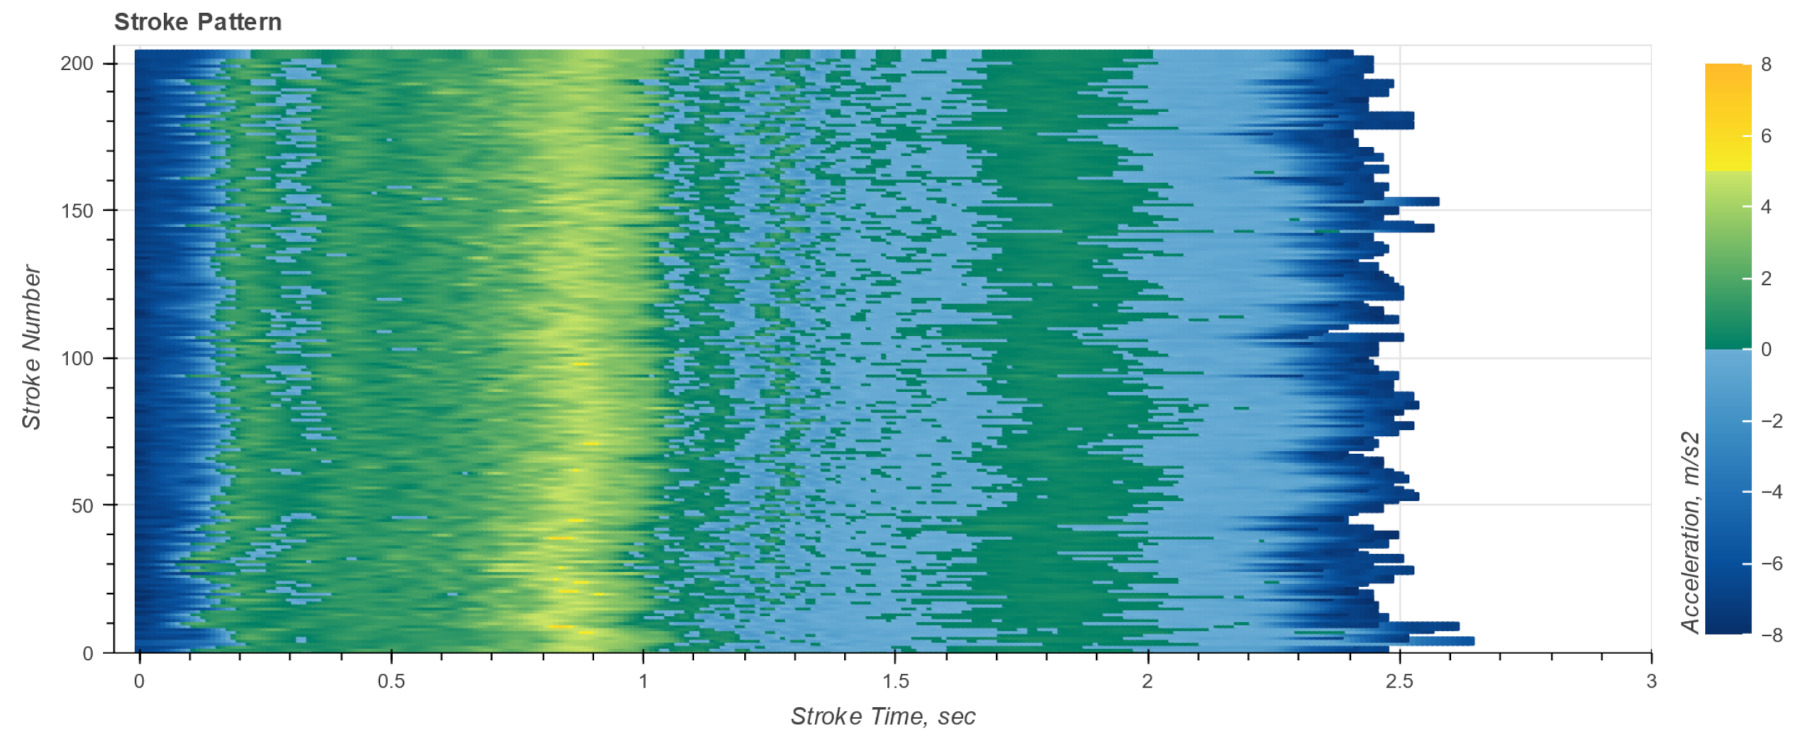
Stroke acceleration pattern. Blue colors are negative accelerations (boat is slowing down) and green - yellow - orange colors positive acceleration (boat is gaining speed). For this plot the entire acceleration has been cut into strokes and stacked on top of each other. The horizontal axis shows the time inside one stroke and the vertical axis the stroke number. The very first stroke performed is displayed on the bottom line and the top line shows the very last stroke.
Training Progress Monitoring
Having all this data available it is crucial to be able to create summaries and offer possibilities to track progress or uncover slow changes over time. For this purpose we have created the training overview, boat crew overview and boat class overview, each providing unique insights and comparison possibilities. A search function further allows a dynamic selection of certain training sessions or segments.
Overall Training Summary
This view shows all data ever recorded and summarizes the distance covered per stroke categorized by stroke rate and colored according to the prognostics (% world best time, WBT). Every column displays the average distance covered during that day for one stroke rate. Every line is one measurement.
Note: for privacy reasons, the data shown below is completely fictional and does not reflect any coherent training schedule or strategy.

Overview by Boat Class or Boat Crew
This overview shows all the segments very recorded for the selected boat class or boat crew. Each segment is shown separately with additional information such as the pace. This table allows for example to discover whether one boat crew is always performing better than any other. On the other hand, training progress and training volume of one particular crew can be analyzed instantly. You no longer need to painfully browse your notes to find out how much and when each crew trained. It's all shown here.
Note: for privacy reasons, the data shown below is completely fictional and does not reflect any coherent training schedule or strategy.

